6
$\begingroup$

I have a region defined like this:

circle = Disk[{4.5, 3}, 0.5];
pin = Rectangle[{4, 0}, {5, 3}];
square = Rectangle[{0, 0}, {9, 9}];
region = RegionDifference[square, RegionUnion[circle, pin]];

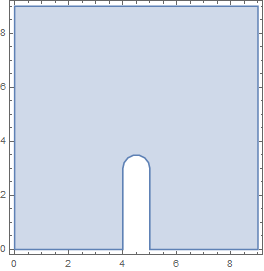
Applying RegionPlot[region] gives this:

Region

Now I need to setup boundary conditions for this region the following way:

1) Top, left, right walls: u[x,y] == 0

2) Bottom wall 0 <= x < 4: u[x,y] == 0

3) Bottom wall 5 < x <= 0: u[x,y] == 0

4) Wall at x = 4, for 0 <= y < 3: u[x,y] == 10

5) Wall at x = 5, for 0 <= y < 3: u[x,y] == 10

6) Semicircle with the center at x = 4.5 and y = 3 (radius = 0.5): u[x,y] == 10

These boundary conditions should be applied to a Laplace equation:

sol = NDSolveValue[{D[u[x, y], x, x] + D[u[x, y], y, y] == 0,
bc},
   u, {x, y} \[Element] region]

DensityPlot[sol[x, y], {x, y} \[Element] region, Mesh -> None, 
 ColorFunction -> "Rainbow", PlotRange -> All, 
 PlotLegends -> Automatic]

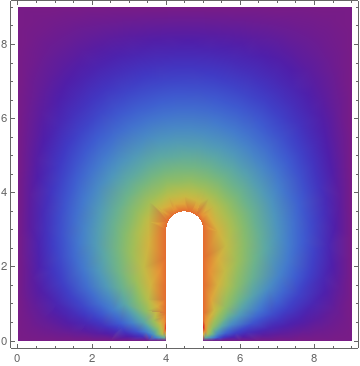
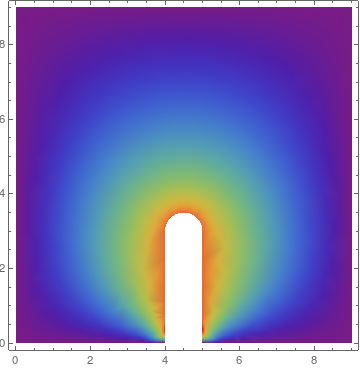
Update 1: the result should be something like this:

image2

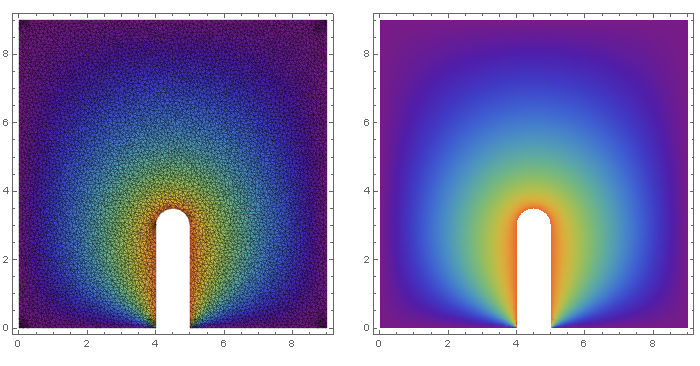
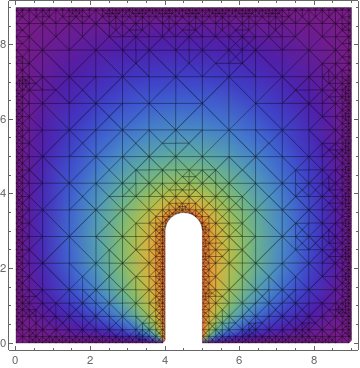
That is what I received when I ran the code provided by user21 on Mathematica 10.3. I introduced:

mesh = ToElementMesh[DiscretizeRegion[region], MaxCellMeasure -> 0.01];

and in plotting I changed Mesh -> All (for the picture on the left)


Update 2: User21 provided a new part of the code:

DensityPlot[sol[x, y], {x, -10, 10}, {y, -10, 10}, Mesh -> All, 
 ColorFunction -> "Rainbow", PlotRange -> All, 
 PlotLegends -> Automatic, MaxRecursion -> 4]

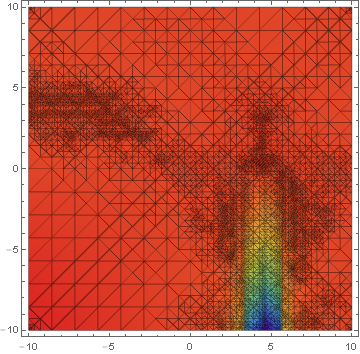
It gives the same plot as what you can see in User21's answer but only if you use Mathematica of the version newer than 10.3. For the version 10.3 I get an error "InterpolatingFunction::dmval: "Input value {-9.99857,-9.99857} lies outside the range of data in the interpolating function. Extrapolation will be used." And the plot looks like this:

error

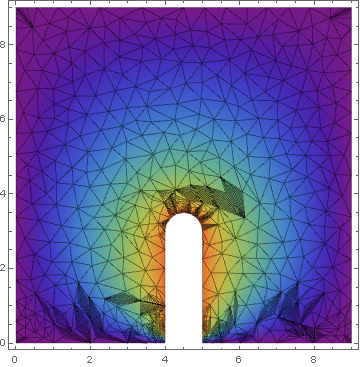
It gets a bit better if I switch {x, -10, 10}, {y, -10, 10} to {x, y} \[Element] region but still the plot looks unacceptable:

error2

$\endgroup$

1 Answer 1

6
$\begingroup$

How about:

circle = Disk[{4.5, 3}, 0.5];
pin = Rectangle[{4, 0}, {5, 3}];
square = Rectangle[{0, 0}, {9, 9}];
region = RegionDifference[square, RegionUnion[circle, pin]];
bc = {DirichletCondition[u[x, y] == 0, 
    y == 0 || y == 9 || x == 0 || x == 9], 
   DirichletCondition[u[x, y] == 10, (4 <= x <= 5) && y <= 4]};
sol = NDSolveValue[{D[u[x, y], x, x] + D[u[x, y], y, y] == 0, bc}, 
   u, {x, y} \[Element] region];

DensityPlot[sol[x, y], {x, y} \[Element] region, Mesh -> None, 
 ColorFunction -> "Rainbow", PlotRange -> All, 
 PlotLegends -> Automatic]

enter image description here

If you use a higher MaxRecursion the graphics get smoother:

DensityPlot[sol[x, y], {x, y} \[Element] region, Mesh -> None, 
 ColorFunction -> "Rainbow", PlotRange -> All, 
 PlotLegends -> Automatic, MaxRecursion -> 4]

enter image description here

It gets better when you use:

DensityPlot[sol[x, y], {x, -10, 10}, {y, -10, 10}, Mesh -> All, 
 ColorFunction -> "Rainbow", PlotRange -> All, 
 PlotLegends -> Automatic, MaxRecursion -> 4]

enter image description here

$\endgroup$
8
  • $\begingroup$ I did the trick. Thanks! I have one extra question. How to make the result smoother? I try some codes straight from Mathematica website where the results look very smooth. When I execute them in my Mathematica 10.3, they look a bit "spiky" like this solution that you provided. I guess the mess needs to be denser? $\endgroup$ Commented Apr 23, 2017 at 19:43
  • $\begingroup$ Wait a second. Something is wrong. If I run this code, I see several messages from InterpolatingFunction "Input value {4.00619,3.02712} lies outside the range of data in the interpolating function. Extrapolation will be used." And then there is a general message "Further output of InterpolatingFunction::dmval will be suppressed during this calculation." If I refine the mesh, the result looks the same because calculation stops at some point. $\endgroup$ Commented Apr 23, 2017 at 21:26
  • $\begingroup$ I noticed that rather than using a region for PDE solution, it is better to define mesh. I did that like this mesh = ToElementMesh[DiscretizeRegion[region], MaxCellMeasure -> 0.01]; As a result the simulation doesn't have any problems anymore. $\endgroup$ Commented Apr 24, 2017 at 19:14
  • 2
    $\begingroup$ @ViacheslavPlotnikov, no that is certainly the not the best approach. Remove the call to DiscretizeRegion $\endgroup$
    – user21
    Commented Apr 25, 2017 at 0:47
  • $\begingroup$ I see what happened here. I tried to call DiscretizeRegion and the result looked much better. But I did it today in Mathematica 10.3. There seem to be a great difference. $\endgroup$ Commented Apr 25, 2017 at 2:35

Your Answer

By clicking “Post Your Answer”, you agree to our terms of service and acknowledge you have read our privacy policy.

Not the answer you're looking for? Browse other questions tagged or ask your own question.