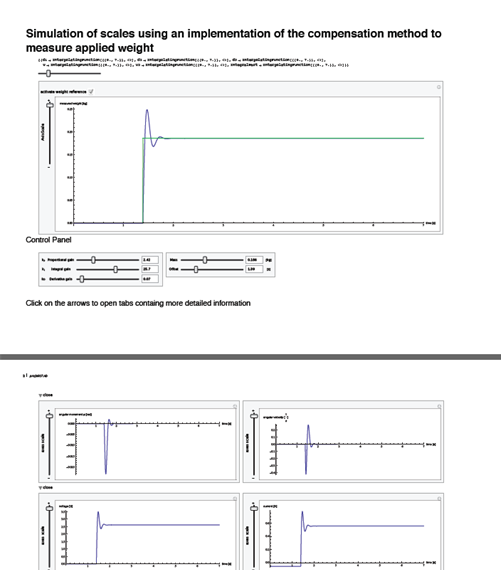
As the title says, I want a cell containing the dynamic solution of a DAE-System to be available over the whole document. I use a lot of different Plots and Sliders scattered over the document and it is pretty annoying that after the cell scrolled off screen, the dynamic stuff stops working altogether (as this is the nature of Dynamic as the documentation explains it). If I copy Dynamic[Solution] and insert it all over the place everything works perfectly fine but does of course look unprofessional. Therefore I tried DynamicWrapper["This is a text", Dynamic[Solution]] to hide Dynamic[Solution] inside titles and texts that are scattered around anyway. This does however not work as I imagined it must.
If someone has an idea how to comfortably solve the issue I would be glad.
Edit: The system is a scale that works by compensation method; some code:
This is my variable called solution
solution =
Dynamic[sol2 =
Quiet[NDSolve[{d1'[t] == d2[t],
d2'[t] == k*d1[t] + b*d2[t] + (ki*l)/\[Theta][t]*d3[t] + (l*g)/\[Theta][t]*
         (mersatz - mass[t, offset, Mass]),
d3'[t] == -((ki*l)/L)*d2[t] - R/L*d3[t] + (U[t] + Uoffset)/L,
U[t] == kP*U2[t] + kI*IntegralPart[t] + kD*U2'[t],
U2[t] == -ks*l* d1[t],
D[IntegralPart[t], {t, 1}] == U2[t],
d1[0] == 0, d2[0] == 0, d1'[0] == 0,
d2'[0] == (l*ki)/\[Theta][0]*Uoffset/R + (l*g)/\[Theta][0]*
          (mersatz - mass[0, offset, Mass]),
  d3'[0] == 0, d3[0] == Uoffset/R , U[0] == 0, U2[0] == 0,
  IntegralPart[0] == 0}, {d1, d2 , d3, U, U2, IntegralPart}, {t,
  0, duration}
 ]]]
After that follows a big plot of the measured / calculated load on my scale
PlotWeight =
Manipulate[
Quiet[Plot[{measuredweight[t] /. sol2,
 If[referencew == 1, mass[t, offset, Mass], ""]} , {t, 0,
 duration}, PlotStyle -> {Automatic, Darker[Green]},
ImageSize -> {1200, 400}, AspectRatio -> Full,
ExclusionsStyle -> {Darker[Green], None},
AxesLabel -> {Style["time [s]", FontFamily -> font1],
  Style["measured weight [kg]", FontFamily -> font1]},
PlotRange -> {{0, duration}, If[scale == 1, Full, {0, scale}]}]],
Style["      +", 12]
, {{scale, 1,
Rotate[Style["AxisScale", FontFamily -> font1, FontSize -> 12],
 90 \[Degree] ]}, 0.01, 1, ControlType -> VerticalSlider},
Style["      -",
12], {{referencew, 0,
Style["activate weight reference", FontFamily -> font1,
 FontSize -> 12]} , {0, 1}},
ControlPlacement -> {Left, Left, Left, Top}, Alignment -> Center ]
Other variables displayed in interactive Plots are current, voltage, angular velocity, angle, etc. All those are coming from the DAE that is fitted in solution (in the variable sol2 inside of solution).

A full picture in this Pdf.

CurrentValue[InputNotebook[], DockedCells] = (Pause[3]; NotebookRead[InputNotebook[]])and as soon as you evaluate you have 3 seconds to select the cell you want to get docked and wait for it >P $\endgroup$solutionas a variable defined here isDynamic[(*some stuff*)]while the comments above suggest thatsolutionis used in the formPlot[U[t]/.solution...]. As Rojo says, there are many possible answers to the question, but I just don't feel I understand the question well enough to say which (if any) of them are appropriate for you. Incidentally, an additional tool I would add to Rojo's list is the use of notebook-levelTaggingRulesto emulate notebook-levelDynamicModulevariables. See the examples section of theTaggingRulesdocs for more info. $\endgroup$