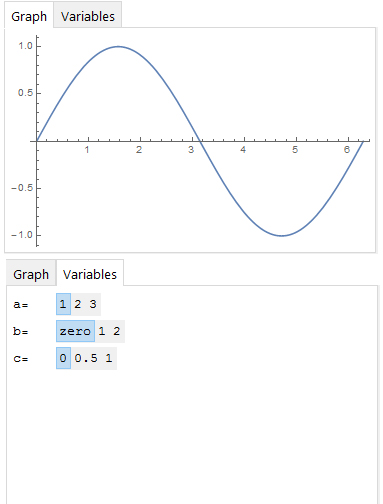
I want to display a clickable graph using ClickPane (on tab one) while behind it are several tabls with lists of items and three options (clickboxes?) next to each (so that the user can change the default allocation of one of three values to each item). Is the best framework in which to do this a Manipulate command? What are the corresponding commands for the tabs and the boxes?
-
1$\begingroup$ Is this related? 5576 $\endgroup$– jjc385Commented Mar 31, 2017 at 1:04
1 Answer
Pursuant to jjc385's comment, the ideal answer is
DynamicModule[{tab = 2},
 TabView[{
   "Variables" ->
    TabView[{"A" -> TableForm@{{"a=", SetterBar[Dynamic[a], Range@3]},
         {"b=", SetterBar[Dynamic[b], {0 -> "zero", 1, 2}]},
         {"c=", SetterBar[Dynamic[c], {0, .5, 1}]}}
      , "B" -> "Nothing here."}]
   ,
   "Graph" ->
    Dynamic@Plot[Sin[a x + b] + c,
     {x, 0, 2 Pi}]
   }, Dynamic[tab]]
 ]
which is a little different than the prior code which produced
Now, the user can change several variables and the display only switches to the graph when the user tabs to it. Thanks!

