8
$\begingroup$

I am trying to make an agent based model similar to

to approximate the solution to a system of PDEs which describe two interacting populations (i.e. Prey and predators).

I would like to specify the initial distribution with a simple picture such as one of these two:

img = Import["https://i.sstatic.net/9io21.gif"]

img = Import["https://i.sstatic.net/J2JQK.png"]

where white and black represent the distribution of two different populations.

Also is it possible to turn a picture into a distribution function in two dimensions?

$\endgroup$
3
  • $\begingroup$ What do you mean by "a distribution function in two dimensions"? $\endgroup$
    – C. E.
    Commented Mar 26, 2017 at 20:52
  • $\begingroup$ @C.E. This is a complex request and may be very difficult to do for an arbitrary image. What I am asking for is some code that takes a image that produces either level curves, piece wise function, or some other function. i.e. a square can be described by the piecewise function u(x,y)=1 if (x,y) ∈[0,1], 0 if (x,y)∉[0,1] $\endgroup$
    – AzJ
    Commented Mar 26, 2017 at 21:59
  • $\begingroup$ ok, I understand what you mean now. I added something about that to my answer. $\endgroup$
    – C. E.
    Commented Mar 26, 2017 at 22:07

2 Answers 2

11
$\begingroup$

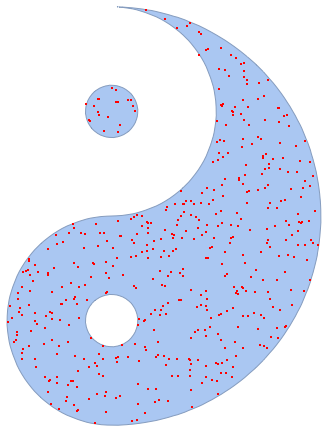
You have to use ColorNegate and other image processing functions to make the area that you want to sample is white, while the rest is black. After that you can use ImageMesh and RandomPoint like this:

img = Import["https://i.sstatic.net/J2JQK.png"];

mesh = ImageMesh[ColorNegate[img]];
pts = RandomPoint[mesh, 500];

Show[mesh,ListPlot[pts, PlotStyle -> Red]]

Mathematica graphics

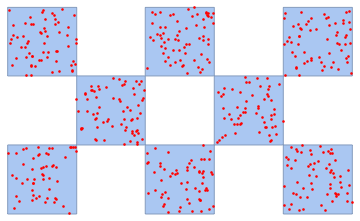
img = Import["https://i.sstatic.net/9io21.gif"];

mesh = ImageMesh[ColorNegate[img]];
pts = RandomPoint[mesh, 500];

Show[mesh, ListPlot[pts, PlotStyle -> Red]]

Mathematica graphics

To check if a point is inside the region, you might use RegionMember. This could be used as a "distribution function". (In this example, mesh corresponds to the first image in this answer.)

f = RegionMember[mesh];
{f[{0, 0}], f[{1500, 1500}]}

{False, True}

$\endgroup$
2
  • $\begingroup$ This is helpful. How can I do the same with the white space? I have replaced by original picture with a transparent (not white background) to make this easier. (Link to new pic:i.sstatic.net/J2JQK.png so have to download it to see that it is transparent) $\endgroup$
    – AzJ
    Commented Mar 26, 2017 at 19:58
  • $\begingroup$ @AzJ With the new transparent version all you have to do is remove ColorNegate to get the opposite part. $\endgroup$
    – C. E.
    Commented Mar 26, 2017 at 20:00
7
$\begingroup$

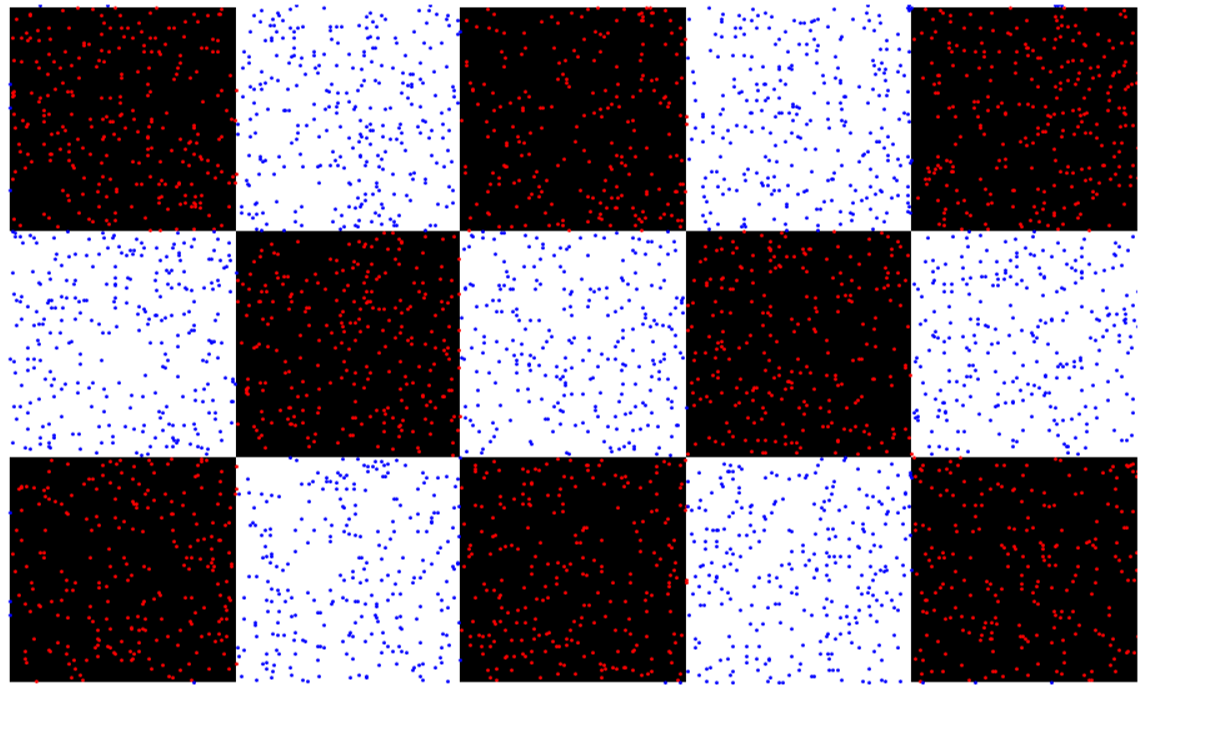
you can use PixelValuePositions

Show[image, MapThread[Graphics[{#2, Point@RandomSample[PixelValuePositions[image, #1], 
   2000]}] &, {{0, 1}, {Red, Blue}}]]

enter image description here

of course there are some outlying points and that is because your image has a thin white border surrounding it

$\endgroup$
2
  • $\begingroup$ @C.E. you are right. No need to replace. I was not clearly thinking. Thanks for letting me know ! $\endgroup$
    – Ali Hashmi
    Commented Mar 26, 2017 at 20:41
  • 1
    $\begingroup$ @C.E. i edited the answer $\endgroup$
    – Ali Hashmi
    Commented Mar 26, 2017 at 20:43

Your Answer

By clicking “Post Your Answer”, you agree to our terms of service and acknowledge you have read our privacy policy.

Not the answer you're looking for? Browse other questions tagged or ask your own question.