I am solving a classical PDE on a current through a composite conductive material:
$$\operatorname{div}(\sigma \operatorname{grad}u)=0$$
where $u=u(x,y)$ is the electrical potential and $\sigma$ is the conductivity. The problem is a 2D one. The domain consists of several sub-domains with the internal boundaries, each sub-domain has its own conductivity, sigma.
What I want is to evaluate and analyze the heat production.
$$P=\sigma\,(\operatorname{grad}u)^2$$
Say, I need to plot it along certain lines, or evaluate its value in certain points.
Below for the sake of simplicity I only consider a rectangular domain with one vertical internal boundary in the middle.
The potential in this problem can be found as follows. The code below makes the boundary and element meshes, the element mesh containing the region markers 1 and 2 indicating domains with the different conductivities:
<< NDSolve`FEM`
bm = ToBoundaryMesh[
   "Coordinates" -> {{0., 0.}, {1., 0.}, {2., 0.}, {2., 1.}, {1.,
      1.}, {0., 1.}},
   "BoundaryElements" -> {LineElement[{{1, 2}, {2, 3}, {3, 4}, {4,
        5}, {5, 6}, {6, 1}, {5, 2}}]}];
em = ToElementMesh[bm,
   "RegionMarker" -> {{{0.5, 0.5}, 1}, {{1.5, 0.5}, 2}}];
It looks like the following
    Show[{
  em["Wireframe"["MeshElementStyle" -> Directive[EdgeForm[Red], Thin],
     "MeshElementMarkerStyle" -> Blue]],
  bm["Wireframe"["MeshElementStyle" -> Black]]
  }, ImageSize -> 300]
Now I can solve the equation assuming sigma=1 in the first domain and sigma=2 in the second:
    sigma = If[ElementMarker == 1, 1, 2];
sl1 = NDSolveValue[{D[sigma*D[u[x, y], x], x] +
     D[sigma*D[u[x, y], y], y] == 0, DirichletCondition[u[x, y] == 0, x == 0],
   DirichletCondition[u[x, y] == 1, x == 2]}, u[x, y], {x, y} ∈ em]
and here is the solution:
 Plot3D[sl1, {x, y} ∈ em, ColorFunction -> "Rainbow",
 PlotRange -> {0, 1}, ImageSize -> 300]
which looks as it is expected.
Everything was OK until this point. Now a difficulty comes. I need to evaluate the heat power, sigma*(D[u[x, y], x]^2 + D[u[x, y], y]^2). However, this can only be done on the mesh, since only the mesh "knows" the values of the region markers, but without the mesh Mathematica does not know, what are they. I can, for example, integrate the heat power on the mesh:
NIntegrate[
 Evaluate[sigma*(D[sl1, x]^2 + D[sl1, y]^2)], {x, y} ∈ em]

(* 0.667 *)
I cannot, however, say, evaluate its value in a point
sigma*(D[sl1, x]^2 + D[sl1, y]^2) /. {x -> 0.5, y -> 0.5}

(* 0.444 If[ElementMarker == 1, 1, 2] *)
since it is not a mesh-related operation.
I would like to stress, that in this example there is a trivial solution:
    If[x < 1, 1, 2]*(D[sl1, x]^2 + D[sl1, y]^2) /. {x -> 0.5, y -> 0.5}
(*  0.444  *)
It cannot be applied in my real case, since the internal boundaries are multiple and have complex shapes.
I tried to add the definitions of the currents into the list of equations:
 sl2 = NDSolveValue[{D[sigma*D[u[x, y], x], x] +
     D[sigma*D[u[x, y], y], y] == 0, jx[x, y] == sigma*D[u[x, y], x],
   jy[x, y] == sigma*D[u[x, y], y],
   DirichletCondition[u[x, y] == 0, x == 0],
   DirichletCondition[u[x, y] == 1, x == 2]}, {u[x, y], jx[x, y],
   jy[x, y]}, {x, y} ∈ em]
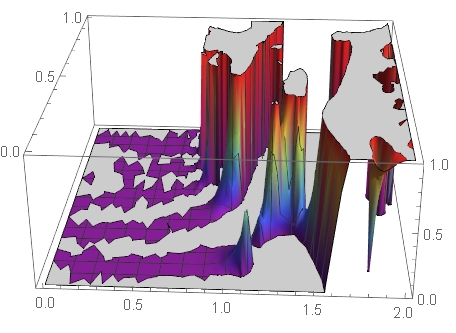
which gives an evident warning: "No DirichletCondition or Robin-type NeumannValue was specified for {jx,jy}; the result is not unique up to a constant", and returned an incorrect solution for the potential:
Plot3D[sl2[[1]], {x, y} ∈ em, ColorFunction -> "Rainbow",
 PlotRange -> {0, 1}, ImageSize -> 300]
My question Have you an idea of the work around, to evaluate and print the expression for the heat power?


