Consider the example below:
Z0 = {{1, 0, 0}, {0, 1, -2}, {3, 0, 1}};
Z1 = {{1, 2, 0}, {1, 0, 3}, {0, 0, 0}};
Z2 = {{0, 0, 0}, {-2, 0, 1}, {0, -3, 1}};

Plot[
 Sort@(Re /@ Eigenvalues[Z0 + u Z1 + u^2 Z2]),
 {u, -2, 2},
 PlotRange -> All,
 (*ColorFunction ->,*)
 AspectRatio -> 1
 ]
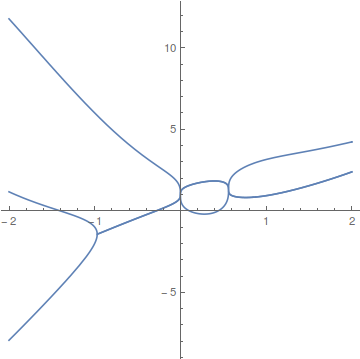
which produces the following output:
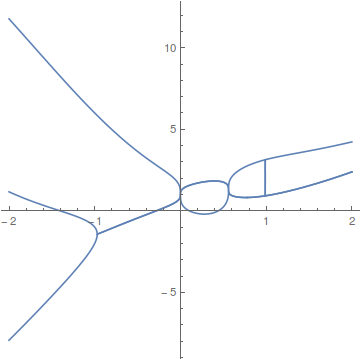
Basically, I am plotting the real part of the eigenvalues of the matrix $Z(u) = Z_0 + u Z_1 + u^2 Z_2$ as a function of the parameter $u \in [-2,+2]$. The use of Sort ensures that the curves are "joined correctly", avoiding the following undesired effect (at $u=1$ in this example):
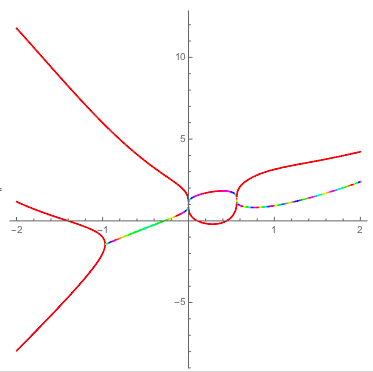
Is it possible to develop a ColorFunction for this plot, so that the color of each point is a function of the respective imaginary part of the eigenvalue (which will allow to identify which curve represents each mode)?


