1
$\begingroup$

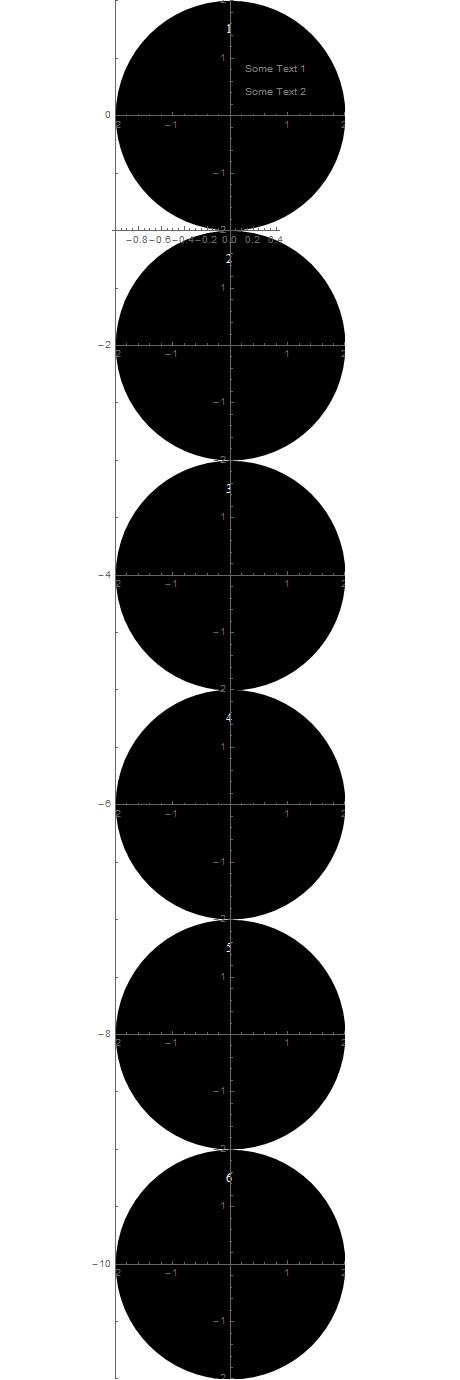
I have six graphs (each roughly fits in a circle with radius 2 at the origin) which I want to combine placing one above the other and then place text on them. I am trying to use Inset as in the following example and the results are utterly unpredictable, PlotRange makes no sense and PlotRange->All does not work. Moreover, I would have expected (and would like) the first graph (disk 1) to use the same coordinates are the final one, the wrapping graphic the coordinates of which the text uses. Any ideas? (Using Ma 10.1)

Example code:

Graphics[{
  Table[
   Inset[
    Graphics[{
      Disk[{0, 0}, 2], White, Text[j, {0, 1.5}]
     }, Axes -> True,
     PlotRangePadding -> 0, ImagePadding -> 0]
    , {0, 0}, {0, 4 (j - 1)}, 2], {j, 6}],
  Gray, Text["Some Text 1", {.4, .4}],
  Text["Some Text 2", {.4, .2}]
  }, PlotRange -> {Automatic, {1, -11}},
 Axes -> True, 
 AxesOrigin -> {-1, -1}]

enter image description here

$\endgroup$
8
  • $\begingroup$ What is the function txt? Side note: use ` for inline code such as inline code. Otherwise, indent your code with four spaces (or click on the {} icon). $\endgroup$
    – anderstood
    Commented Feb 25, 2017 at 23:12
  • $\begingroup$ Yes, changed txt to Text, sorry. $\endgroup$
    – Nicholas G
    Commented Feb 26, 2017 at 0:01
  • $\begingroup$ @anderstood, how can I change the coordinates of circles 2 through 6 inside a Show? I tried Table[ {Disk[{0, 0}, 2], White, txt[j, {0, 1.5}]} /. {x_Real, y_Real} :> {x, y - 2 j} , {j, 6}] and variants of it but it does not work. $\endgroup$
    – Nicholas G
    Commented Feb 26, 2017 at 0:08
  • 1
    $\begingroup$ Pardon me, I don't understand I would have expected (and would like) the first graph (disk 1) to use the same coordinates are the final one, the wrapping graphic the coordinates of which the text uses. Would you please try stating that differently or providing some kind of example? $\endgroup$
    – Mr.Wizard
    Commented Feb 26, 2017 at 0:17
  • 2
    $\begingroup$ I'm voting to close this question as off-topic because the issued raised is not really a problem; it is arises from the OP's misunderstanding of the result returned by Mathematica. $\endgroup$
    – m_goldberg
    Commented Feb 26, 2017 at 2:11

2 Answers 2

3
$\begingroup$

Perhaps

Graphics[{Translate[{Opacity[.5, Pink], Disk[{0, 0}, 2], 
          Opacity[1, Purple], Text[# + 1, {0, 1.5}]}, {0, -4 #}] & /@ Range[0, 5], 
  Cyan, Text["Some Text 1", {.5, .5}], Text["Some Text 2", {.5, .1}]},
  PlotRange -> All, Axes -> True, AxesOrigin -> {-1, -1}]
Mathematica graphics

$\endgroup$
4
  • $\begingroup$ One problem. Each circle should have its own Graphics wrapper to simulate the fact that I will be using other graphics, already produced. I do not see how that would work with Translate. If you could wrap Opacity ... Disk... Text... inside a Graphics maybe that would work. $\endgroup$
    – Nicholas G
    Commented Feb 26, 2017 at 1:18
  • $\begingroup$ @NicholasG, you can use Graphics[...][[1]] with Translate. For example, Graphics[{Translate[ Graphics[{Opacity[.5, Pink], Disk[{0, 0}, 2], Opacity[1, Purple], Text[# + 1, {0, 1.5}]}][[1]], {0, -4 #}] & /@ Range[0, 5], Cyan, Text["Some Text 1", {.5, .5}], Text["Some Text 2", {.5, .1}]}, PlotRange -> All, Axes -> True, AxesOrigin -> {-1, -1}]. See also this for a similar use of Translate. $\endgroup$
    – kglr
    Commented Feb 26, 2017 at 1:23
  • $\begingroup$ Fabulous, this works. Why do we have to pass the first element of prior graphics to Translate instead of the prior graphic itself? $\endgroup$
    – Nicholas G
    Commented Feb 26, 2017 at 11:32
  • $\begingroup$ @NicholasG, the first argument of Translate has to be a graphics primitive. $\endgroup$
    – kglr
    Commented Feb 26, 2017 at 11:50
2
$\begingroup$

Let us look at your graphics with a few modification to improve the visibility of the elements that are displayed.

Graphics[
  {Table[
     Inset[
       Graphics[
         {GrayLevel[.8], Disk[{0, 0}, 2],
          White, Text[j, {.5, -1}]},
         Axes -> True,
         PlotRangePadding -> 0,
         ImagePadding -> 0],
       {0, 0}, {0, 4 (j - 1)}, 2],
     {j, 6}],
   Text["Some Text 1", {.4, .4}],
   Text["Some Text 2", {.4, .2}]},
   PlotRange -> {{-1, 1}, {1, -11}},
   Axes -> True,
   AxesLabel -> {"outer-x", "outer-y"},
   AxesOrigin -> {-1, -1},
   ImagePadding -> {{20, 50}, {Automatic, Automatic}}]

disks

There is nothing at all to complain about in the resulting graphics. Everything is displayed in exactly in the position that was specified for it.

All elements specified in the outer Graphics expression, including the six disks, appear correctly placed in the outer coordinate system. All elements specified in the Inset expression appear correctly placed in the local coordinate system of their inset Graphics expression and are scaled to double size in the outer coordinate system because you specified a scale of 2 for them.

$\endgroup$
1
  • $\begingroup$ Bravo! Then, the question becomes what is the correct scaling factor to use so the coordinates for the first graph become those of the outer system. I would have thought 1 might work but no, it ends up being 4. Why? That the width of the inner graph is four and so it should take four units of the outer system? I suppose I should give up on PlotRange->All just working. $\endgroup$
    – Nicholas G
    Commented Feb 26, 2017 at 10:56

Not the answer you're looking for? Browse other questions tagged or ask your own question.