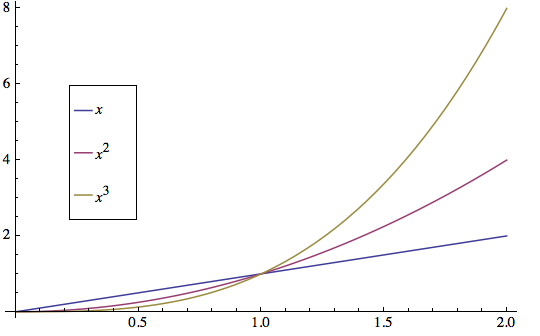
I have an old version of Mathematica 8 and can only find information for #>9 I need to label multiple curves in a Plot[.] function with legends to the side of the graph. Your answer needs to be as simple as possible so I don't have to figure out what you said by reading the entire users manual. (2-3 lines of code MAX) Is there a "mathematica for engineers" manual that actually speaks to the highly limited areas needed by engineers,,,meaning complex functions, control systems, and plotting and labeling 2-3 dimensional data??
1 Answer
$\begingroup$
$\endgroup$
$Version

(*  "8.0 for Mac OS X x86 (64-bit) (July 22, 2012)"  *)

Needs["PlotLegends`"]

Plot[
 Evaluate@Table[Tooltip[x^n], {n, 3}],
 {x, 0, 2},
 PlotLegend -> Table[x^n, {n, 3}],
 LegendShadow -> None,
 LegendPosition -> {-0.75, -0.2},
 LegendSize -> {0.25, 0.5}]

