ClearAll["Global`*"];
Subscript[i, 0] := {{1 - 1/E^(1/10),
   5.196153021391857`}, {1 - 1/E^(1/5),
   5.196159705940993`}, {1 - 1/E^(3/10),
   5.196180885069776`}, {1 - 1/E^(2/5),
   5.196222762115215`}, {1 - 1/Sqrt[E],
   5.196288209096974`}, {1 - 1/E^(3/5),
   5.196377257424081`}, {1 - 1/E^(7/10),
   5.196487957277755`}, {1 - 1/E^(4/5),
   5.196617178572843`}, {1 - 1/E^(9/10), 5.19676123455273`}, {1 - 1/E,
    5.1969163216793515`}}
Subscript[i, 1] := {{1 - 1/E^(1/10),
   5.19191873287261`}, {1 - 1/E^(1/5),
   5.191925494281923`}, {1 - 1/E^(3/10),
   5.1919469304276875`}, {1 - 1/E^(2/5),
   5.191989341643741`}, {1 - 1/Sqrt[E],
   5.192055661285492`}, {1 - 1/E^(3/5),
   5.192145944109194`}, {1 - 1/E^(7/10),
   5.19225823182757`}, {1 - 1/E^(4/5),
   5.192389362814114`}, {1 - 1/E^(9/10),
   5.192535604203823`}, {1 - 1/E, 5.192693098899519`}}
Subscript[i, 2] := {{1 - 1/E^(1/10),
   5.771775702415989`}, {1 - 1/E^(1/5),
   5.771779980434482`}, {1 - 1/E^(3/10),
   5.771793319215499`}, {1 - 1/E^(2/5),
   5.771819298487611`}, {1 - 1/Sqrt[E],
   5.771859339949759`}, {1 - 1/E^(3/5),
   5.771913134732232`}, {1 - 1/E^(7/10),
   5.771979242055644`}, {1 - 1/E^(4/5),
   5.772055604738526`}, {1 - 1/E^(9/10), 5.77213992681313`}, {1 - 1/E,
    5.7722299243470445`}}
Subscript[i, 3] := {{1 - 1/E^(1/10),
   5.201117908780306`}, {1 - 1/E^(1/5),
   5.201124560147791`}, {1 - 1/E^(3/10),
   5.201145637585236`}, {1 - 1/E^(2/5),
   5.2011873188104385`}, {1 - 1/Sqrt[E],
   5.201252466062782`}, {1 - 1/E^(3/5),
   5.201341113234828`}, {1 - 1/E^(7/10),
   5.201451320907582`}, {1 - 1/E^(4/5),
   5.201579973722657`}, {1 - 1/E^(9/10),
   5.201723401383306`}, {1 - 1/E, 5.201877816815951`}}
Subscript[i, 4] := {{1 - 1/E^(1/10),
   5.2510206064477964`}, {1 - 1/E^(1/5),
   5.251027254946757`}, {1 - 1/E^(3/10),
   5.251048271461156`}, {1 - 1/E^(2/5),
   5.251089743481776`}, {1 - 1/Sqrt[E],
   5.2511544448332`}, {1 - 1/E^(3/5),
   5.2512423458399775`}, {1 - 1/E^(7/10),
   5.251351475521756`}, {1 - 1/E^(4/5),
   5.251478716734289`}, {1 - 1/E^(9/10),
   5.251620420810767`}, {1 - 1/E, 5.2517728383892575`}}


Plot[{Interpolation[Subscript[i, 0]][a]}, {a, 0, 1}]
Plot[{Interpolation[Subscript[i, 1]][a]}, {a, 0, 1}]
Plot[{Interpolation[Subscript[i, 2]][a]}, {a, 0, 1}]
Plot[{Interpolation[Subscript[i, 3]][a]}, {a, 0, 1}]
Plot[{Interpolation[Subscript[i, 4]][a]}, {a, 0, 1}]
Plot[{Interpolation[Subscript[i, 0]][a],
  Interpolation[Subscript[i, 1]][a],
  Interpolation[Subscript[i, 2]][a],
  Interpolation[Subscript[i, 3]][a],
  Interpolation[Subscript[i, 4]][a]}, {a, 0, 1}]
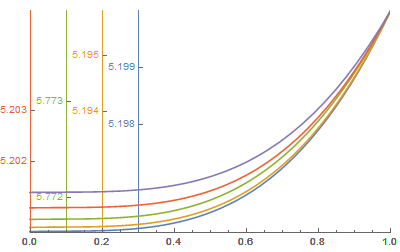
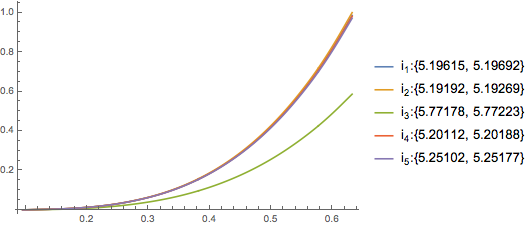
I am trying to plot these five curves in one plot. The problem is that when I do that the lines appear as if they are straight horizontal lines and they don't change as $a$ increases. Is there a way or scale to use to plot these five curves in one plot so that it appears they do change with $a$?
I hope you understand what I mean. Any help is appreciated.


Interpolation[Subscript[i, 3]][a]is straightening all the plots because they-axesrange increases. Perhaps, you can try a double vertical axes for theInterpolation[Subscript[i, 3]][a]mathematica.stackexchange.com/a/629/19742 $\endgroup$Last[Subscript[i, 1]][[2]] - First[Subscript[i, 1]][[2]]gives0.000774, while the difference between any terms of different lists is, say,First[Subscript[i, 4]][[2]] - First[Subscript[i, 1]][[2]]giving0.0591. This is two orders of magnitude greater. For this reason, if you show all the lists on the same plot you cannot visualize the tiny variations within each of the lists. If you show them on different plots, you will see the individual variations. $\endgroup$