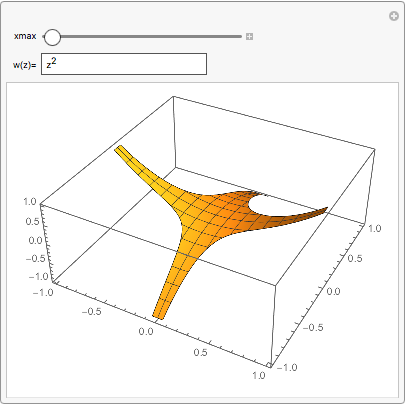
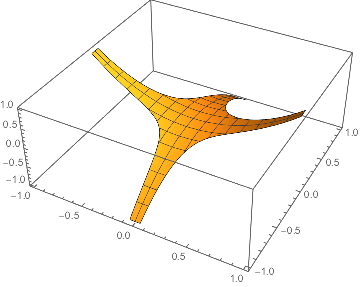
I am trying to visualize polynomials of complex variables inside a "manipulate" environment. I adapted the solution suggested by Michael to one of my previous questions to use a polynomial a user enters in an input field, but I don't get the syntax right. Instead of the usual representation using colors, I try to only plot the real part of the graph, where the imaginary part is close to 0. I use the following code, but I get an error message, where Mathematica tries to interpret my region function.
Manipulate[
With[{f = ReleaseHold[xx /. HoldPattern[tt_ /; MatchQ[tt, Symbol["z"]]] :> x + I*y]},
With[{fReal = Re@f, fIm = Im@f},
Plot3D[fReal, {x, -xmax, xmax}, {y, -xmax, xmax},
 RegionFunction -> Function[{x, y, z}, -0.1 < fIm < 0.1],
 PerformanceGoal -> "Quality"]
]],
{xmax, 1, 10},
{{xx, Unevaluated[z^2], "w(z)="}, InputField[#, Hold[Expression]] &},
{{z, Unevaluated[z]}, ControlType -> None},
Initialization :> (MakeBoxes[z, form_] := FormBox["z", form]) ]
Can someone please explain me how to properly define the RegionFunction?


