i have a data as x and y table and i want to produce a curve showing me all points with zoom if possible , i used listplot[] as shown below :
ListPlot[{c, d, e, f, h, g, x, y(,s)}, Joined -> True, PlotLegends -> {"F" , "M", "MB", "p", "S", "L", "LB", "PS", "E"}, PlotRange -> All, AspectRatio -> 1/GoldenRatio];
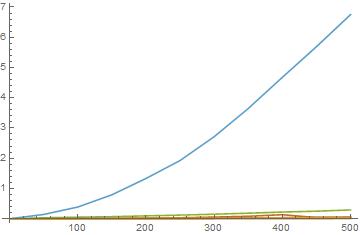
the graph was not clear for the values of y-axis
for example if c has values at 6 and {d,e,f,g,x} has values at 1 or 1.5,0.5 ,0.01 and 2
the curves obtains all on the axis except c


