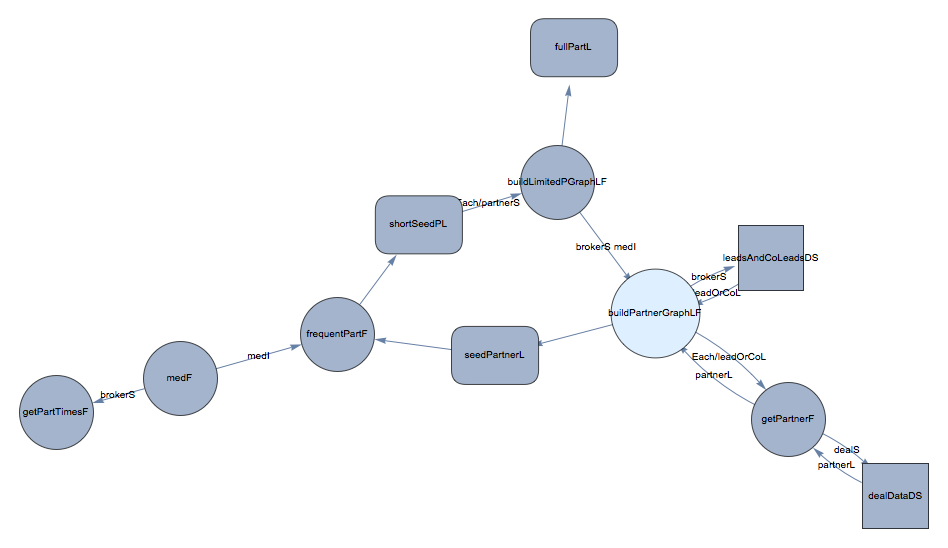
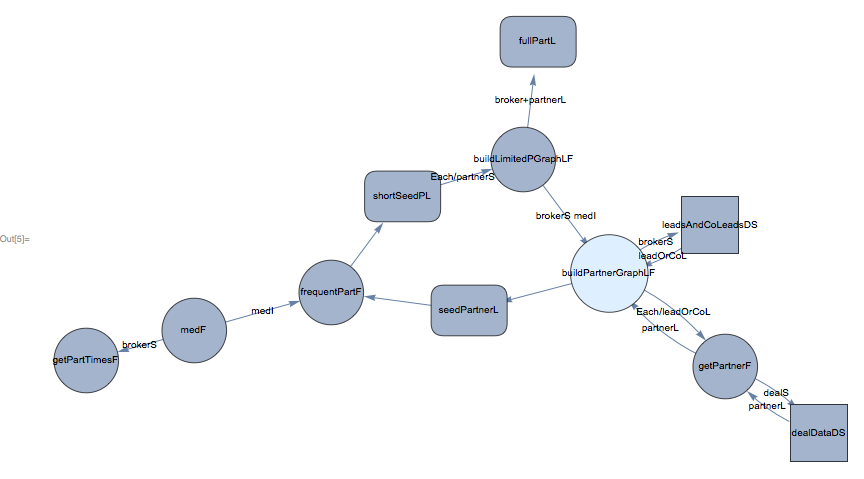
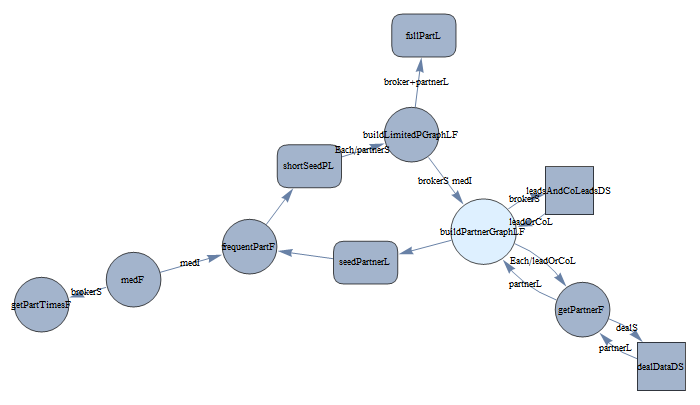
I have constructed a small tool to produce documentation for my code. It constructs dataflow diagrams (my own version) using an association-based data structure and Graph.
The DFDs look pretty good except that some of the labeling gets buried behind some of the vertices, and I haven't been able to figure out how to make them layer as I wish. Take a look at the vertex "buildPartnerGraphLF" which is on top of the edge label.
As background, the association data structure gets translated into the lists below which are then fed to Graph. I include the raw lists. Any help would be appreciated.
 vL = {Property["buildLimitedPGraphLF", VertexShapeFunction -> "Circle"],
  Property["buildPartnerGraphLF", {VertexShapeFunction -> "Circle",
   VertexStyle -> RGBColor[0.87, 0.94, 1], VertexSize -> {0.3, 0.3}}],
  Property["dealDataDS", VertexShapeFunction -> "Square"],
  Property["fullPartL", VertexShapeFunction -> "RoundedRectangle"],
  Property["leadsAndCoLeadsDS", VertexShapeFunction -> "Square"],
  Property["seedPartnerL", VertexShapeFunction -> "RoundedRectangle"],
  Property["shortSeedPL", VertexShapeFunction -> "RoundedRectangle"]}

eL = {"buildLimitedPGraphLF" \[DirectedEdge] "buildPartnerGraphLF",
 "buildLimitedPGraphLF" \[DirectedEdge] "fullPartL",
 "buildPartnerGraphLF" \[DirectedEdge] "getPartnerF",
 "buildPartnerGraphLF" \[DirectedEdge] "leadsAndCoLeadsDS",
 "buildPartnerGraphLF" \[DirectedEdge] "seedPartnerL",
 "dealDataDS" \[DirectedEdge] "getPartnerF",
 "frequentPartF" \[DirectedEdge] "shortSeedPL",
 "getPartnerF" \[DirectedEdge] "buildPartnerGraphLF",
 "getPartnerF" \[DirectedEdge] "dealDataDS",
 "leadsAndCoLeadsDS" \[DirectedEdge] "buildPartnerGraphLF",
 "medF" \[DirectedEdge] "frequentPartF",
 "medF" \[DirectedEdge] "getPartTimesF",
 "seedPartnerL" \[DirectedEdge] "frequentPartF",
 "shortSeedPL" \[DirectedEdge] "buildLimitedPGraphLF"}

eLabL={"buildLimitedPGraphLF" \[DirectedEdge] "buildPartnerGraphLF" ->
  "brokerS medI",
 "buildLimitedPGraphLF" \[DirectedEdge] "fullPartL" ->
  "broker+partnerL",
 "buildPartnerGraphLF" \[DirectedEdge] "getPartnerF" ->
  "Each/leadOrCoL",
 "buildPartnerGraphLF" \[DirectedEdge] "leadsAndCoLeadsDS" ->
  "brokerS", "dealDataDS" \[DirectedEdge] "getPartnerF" -> "partnerL",
  "getPartnerF" \[DirectedEdge] "buildPartnerGraphLF" -> "partnerL",
 "getPartnerF" \[DirectedEdge] "dealDataDS" -> "dealS",
 "leadsAndCoLeadsDS" \[DirectedEdge] "buildPartnerGraphLF" ->
  "leadOrCoL", "medF" \[DirectedEdge] "frequentPartF" -> "medI",
 "medF" \[DirectedEdge] "getPartTimesF" -> "brokerS",
 "shortSeedPL" \[DirectedEdge] "buildLimitedPGraphLF" ->
  "Each/partnerS"}

g1 = Graph[vL, eL, EdgeLabels -> eLabL,
  VertexLabels -> Placed["Name", Center], VertexSize -> {0.25, .25},
  ImageSize -> Full]


VertexStyle -> RGBColor[0.77, 0.76, 0.21, .3]would be a quick way to see all labeling. $\endgroup$