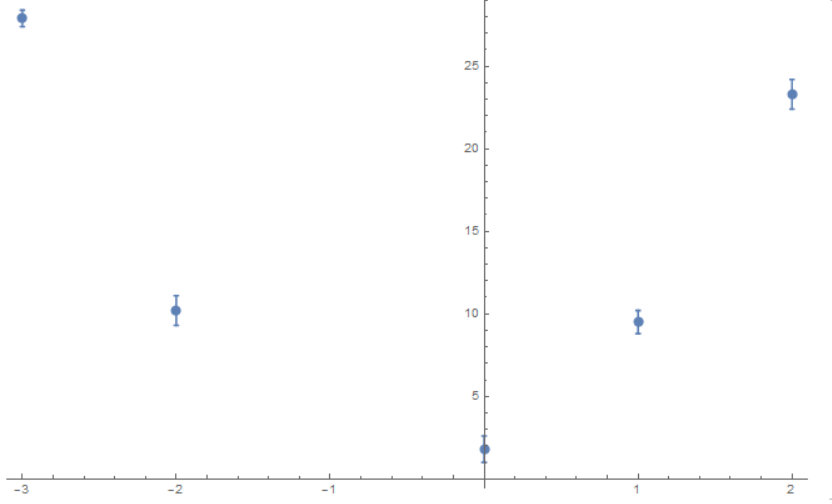
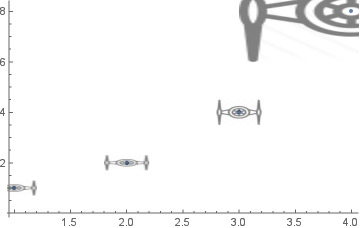
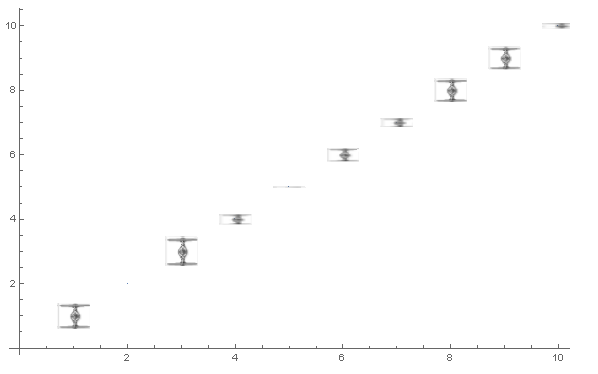
So I'm trying to make a plot using error bars, but instead of errorbars, I'd like to use an image. Let's say we've got the following plot:
 Instead of these error bars, I want to use the image of a tie fighter (turned on its side) instead. So I've imported the image and turned it on its side. Now the problem I'm facing is how to scale and position it within the plot to function as error bars. Do any of you have any ideas on how to do this?
Thanks!
EDIT: So I still can't figure it out, the problem probably lies in that I'm just using uncertainties in y. My code is as follows:
Import["http://vignette2.wikia.nocookie.net/swmerchandise/images/4/45/\
Imperial_TIE_Fighter_(27644)_P.gif"];

Needs["ErrorBarPlots`"]
tijd = {-3, -2, 0, 1, 2}; (*x axis*)
positie = {27.9, 10.2, 1.8, 9.5, 23.3}; (*y axis*)
onzekerheid = {0.5, 0.9, 0.8, 0.7, 0.9}; (*Uncertainty*)

errorplot = {{tijd[[#]], positie[[#]]},
ErrorBar[onzekerheid[[#]]]} & /@ Range[1, Length[tijd]];
position = Transpose[{tijd, positie}];

errorbar[pos_, err_] :=
  With[
   {s = 0.05},
   With[
    {
     corners =
      {{pos[[#]] - s, pos[[#]] - err[[#]]},
         {pos[[#]] + s, pos[[#]] - err[[#]]},
         {pos[[#]] + s, pos[[#]] + err[[#]]},
         {pos[[#]] - s, pos[[#]] + err[[#]]}} & /@
       Range[1, Length[pos]]
 },
{
 Texture[ImageRotate[fighter, \[Pi]/2]],
 Polygon[
  corners,
  VertexTextureCoordinates -> {{0, 1}, {1, 1}, {1, 0}, {0, 0}}
  ]
 }
]
];


ErrorBarFunction? $\endgroup$ErrorBarFunctionis the correct way to approach this, but the examples are rather scarce. $\endgroup$