2
$\begingroup$

I need to find the roots of a nonlinear function, namely:

F[z_] = 2 E^(2 I b z)
z ((-1 + E^(2 I a Sqrt[z^2 - Subscript[V, 0]])) z + (1 + E^(
    2 I a Sqrt[z^2 - Subscript[V, 0]])) Sqrt[
  z^2 - Subscript[V, 0]]) + (E^(2 I a z) - E^(2 I b z)) (-1 + E^(
 2 I a Sqrt[z^2 - Subscript[V, 0]])) Subscript[V, 0]   

where:

$\omega$ is complex valued and $a,V_{0}, b$ are real parameters.

I've been trying to solve numerically this problem by defining a new function

G[x_, y_] := Module[{Z}, Z = x + I*y; Abs[N[1/F[Z]]]]

making a contour plot of this and then approximating the roots by FindRoot

ContourPlot[G[x, y], {x, -10, 10}, {y, -4, 4},PlotLegends -> Automatic, 
FrameLabel -> {"x", "y"}, Mesh -> False, MaxRecursion -> 5]

but it's not giving me the better graphical quality that I need. Is there any better way to evaluate these complex roots?

$\endgroup$
2

1 Answer 1

1
$\begingroup$

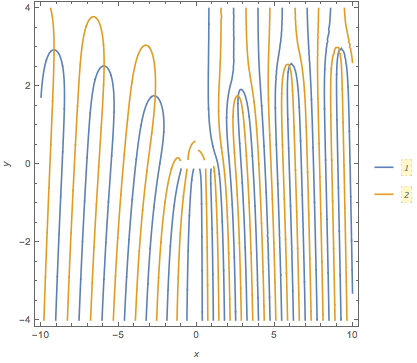
Not sure why G deals with the reciprocal of F, but taking F as the function whose roots are desired, as indicated in the first sentence, I get this:

Block[{b = 1, Subscript, a = 1},
 Subscript[V, 0] = 1;
 NSolve[F[z] == 0 && -10 < Re[z] < 10 && -4 < Im@z < 4, z]
 ]
(*
  {{z -> -9.16236 + 2.93903 I}, {z -> -5.94891 + 2.52432 I},
   {z -> -2.66633 + 1.75482 I}, {z -> 2.66633 + 1.75482 I},
   {z -> 5.94891 + 2.52432 I}, {z -> 9.16236 + 2.93903 I}}
*)

Plot:

Block[{b = 1, Subscript, a = 1},
 Subscript[V, 0] = 1;
 ContourPlot[
  Evaluate@Thread[ReIm[F[x + I y]] == 0], {x, -10, 10}, {y, -4, 4}, 
  PlotLegends -> Automatic, FrameLabel -> Automatic, MaxRecursion -> 3]
 ]

Mathematica graphics

$\endgroup$
11
  • 1
    $\begingroup$ @WaynerKlën See my update. See if that is what you want. $\endgroup$
    – Michael E2
    Commented Dec 14, 2016 at 1:57
  • 1
    $\begingroup$ @WaynerKlën Re@F[z] == 0 and Im[F[z]] == 0. Look up ReIm in the docs (unless you have an old version of Mma). Perhaps you'd like a plot of several contours? If so, which ones? The traditional ones are the real part, imaginary part, absolute value (modulus), and argument. Just apply the appropriate function to F[x + y I] and omit the equality == 0 $\endgroup$
    – Michael E2
    Commented Dec 14, 2016 at 2:44
  • 1
    $\begingroup$ They are the axes of the argument x + I y in F[x + I y]], which would be real and imaginary parts of z = x + I y. The OP does not say how $\omega$ is related to the code, but if it is the same as z, then the answer to your 2nd question is yes. $\endgroup$
    – Michael E2
    Commented Dec 22, 2016 at 16:27
  • 1
    $\begingroup$ @WaynerKlën, most generally the equation w = F[z], with z and w complex, defines a surface in ${\bf R}^4 = {\bf C}^2$, which cannot be plotted (easily) on a screen. The plot in my answer plots two curves, Re[F[x + I y]] == 0 and Im[F[x + I y]] == 0; the intersections are where F == 0. Perhaps you're looking for something like Plot3D[Abs[F[x + I y]], {x, -10, 10}, {y, -4, 4}]? There are various ways for trying to visualize complex functions. (P.S. I just realized I forgot to convert my plot code back to Subscript[V, 0].) $\endgroup$
    – Michael E2
    Commented Dec 22, 2016 at 16:54
  • 1
    $\begingroup$ @WaynerKlën Yes, but for a nonzero $constant$, I would write it as $F(z) - constant == 0$ in the code, and use Evaluate@Thread[ReIm[F[x + I y] - constant] == 0] for the plot. (You don't need to do that for NSolve.) $\endgroup$
    – Michael E2
    Commented Dec 22, 2016 at 17:08

Your Answer

By clicking “Post Your Answer”, you agree to our terms of service and acknowledge you have read our privacy policy.

Not the answer you're looking for? Browse other questions tagged or ask your own question.