5
$\begingroup$

I am trying to solve Laplace equation over a time-dependent region using cylindrical coordinates. My system is independent of the angle coordinate, and so the equation looks like:

Laplace equation

The region represents a container filled with a liquid plus a sphere that falls into it. The bottom and the sides of the container remain fixed. I have used the Finite Element Method to define my region (I have only represented half of it since it is independent of the angle):

Needs["NDSolve`FEM`"]

(*constants*)
ballRadiusSquared = 0.5;
rmax = 10.;
zmin = 0.;
zinit = 4.;
pa = 1.;
g = 9.8;
rho = 1.;
tmax = 0.2;

(*time dependent variable*)
zBallCentre[t_] := -0.5*g*t^2 + zinit + Sqrt[ballRadiusSquared];

(*define region coordinates*)
n = 1000;
(*circle coordinates*)
circTbl = Table[{Sqrt[ballRadiusSquared]*Cos[t], Sqrt[ballRadiusSquared]*Sin[t]}, {t, -Pi/2, Pi/2 - 2 Pi/(2 n), 2 Pi/(2 n)}];
Do[circTbl = ReplacePart[circTbl, {{i, 2}} -> circTbl[[i, 2]] + zBallCentre[0.7]], {i, Length[circTbl]}];
Do[If[circTbl[[i, 2]] > zinit, circTbl = Delete[circTbl, i], circTbl = circTbl], {i, Length[circTbl], 1, -1}];

(*surface coorinates*)
 surfaceTbl = Table[{x, zinit}, {x, 0., rmax, 1/n}];
If[Length[circTbl] == n, surfaceTbl = surfaceTbl, 
    Do[If[circTbl[[Length[circTbl], 1]] > surfaceTbl[[1, 1]],surfaceTbl = Delete[surfaceTbl, 1],surfaceTbl = surfaceTbl],
    {i, 1, n}]];

(*put everything together*)
coordTbl = Join[circTbl, surfaceTbl];
coordTbl = Prepend[coordTbl, {0., zmin}];
coordTbl = Append[coordTbl, {rmax, zmin}];
lineTbl = Partition[Range[Length[coordTbl]], 2, 1];
lineTbl = Prepend[lineTbl, {Length[coordTbl], 1}];

(*mesh the region where de PDE will be solved*)
bmesh = ToBoundaryMesh["Coordinates" -> coordTbl, "BoundaryElements" -> {LineElement[lineTbl]}];
mesh = ToElementMesh[bmesh, MaxCellMeasure -> 0.1];
mesh["Wireframe"]

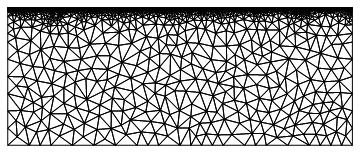
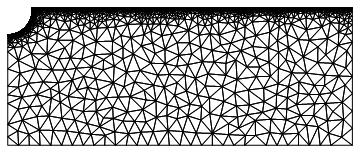
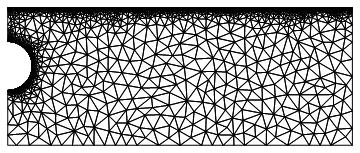
With the following output for t=0 (top), t=0.4 (middle) and t=0.7 (bottom):

Mesh region for t=0 Mesh region for t=0.4 Mesh region for t=0.7

I have used many points for the upper part because it is going to change a lot over time.
Now, I want to impose a Neumann boundary condition on the sphere. The Neumann boundary condition will be given by the component of the velocity of the sphere that is perpendicular to its surface at a given point. So, I have to find a way to impose a different Neumann boundary condition for each of the lines that join the points around the sphere (the points are defined in circTbl, and you can see the definition of the lines in bmesh.).
Do you know how to do it?

Note:
The other boundary conditions that I am using are:

DirCond = DirichletCondition[ϕ[r, z] == 0., r == rmax];
NeumCond = NeumannValue[0., r == 0] + NeumannValue[0., r == rmax] + NeumannValue[0., z == zmin];

And I am solving the Laplace equation in the following way:

solution = NDSolveValue[{D[r*D[ϕ[r, z], r], r]/r + D[ϕ[r, z], {z, 2}] == NeumCond, DirCond}, ϕ, {r, z} ∈ mesh, "ExtrapolationHandler" -> {Automatic, "WarningMessage" -> False}]
$\endgroup$
4
  • $\begingroup$ you mean something like NeumannValue[f[r,z], r^2 + (z-zBallCentre)^2 ==0.5]? where f[r,z] is your velocity? Btw, you could write your code in much simpler way with regions, you don't need to specify the coordinates one by one as you do now. $\endgroup$ Commented Oct 25, 2016 at 18:03
  • $\begingroup$ That is exactly what I want. I totally agree that it is much easier to model the circle with an actual circle! I just could not find a way to merge a boundary mesh (the surface) with a boundary created using ImplicitRegion, in order to create one single region. And I do not want to change the surface boundary mesh. $\endgroup$ Commented Oct 25, 2016 at 19:05
  • $\begingroup$ I would try to rewrite it using the MeshRefinementFunction as the sum of two functions, one for the edge and other for the disk. $\endgroup$ Commented Oct 25, 2016 at 19:58
  • $\begingroup$ The thing is, I really need to have access to the coordinates of the points at the surface. I will move them vertically up and down, depending on the result given by the Laplace equation, and the motion of each point has to be completely independent from the other points. The goal of the code is to reproduce ripples in the liquid. I do not understand how can MeshRefinementFunction help me with that. I do not need, for the moment, to refine the triangular mesh that I am using. $\endgroup$ Commented Oct 25, 2016 at 21:00

1 Answer 1

5
$\begingroup$

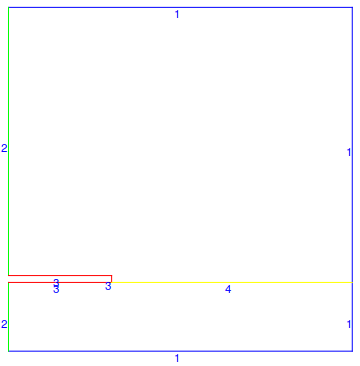
One way to do what you want is by using markers on the boundary. Here is an example. Marker can work in elements, boundary elements and point elements. Here is a boundary mesh which has boundary markers:

Needs["NDSolve`FEM`"]
sh = 0.2; sh2 = 0.02; sw = 0.3;
bmesh = ToBoundaryMesh[
   "Coordinates" -> {{0., 0.}, {1., 0.}, {1., sh}, {1., 1.}, {0., 
      1.}, {0., sh + sh2}, {sw, sh + sh2}, {sw, sh}, {0., sh}}, 
   "BoundaryElements" -> {LineElement[{{1, 2}, {2, 3}, {3, 4}, {4, 
        5}, {5, 6}, {6, 7}, {7, 8}, {8, 9}, {9, 1}, {3, 8}}, {1, 1, 1,
        1, 2, 3, 3, 3, 2, 4}]}];
bmesh["Wireframe"["MeshElementMarkerStyle" -> Blue, 
  "MeshElementStyle" -> {Blue, Green, Red, Yellow}]]

enter image description here

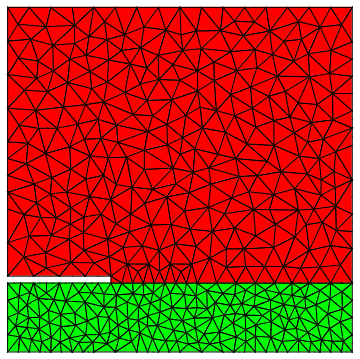
We generate a full mesh:

mesh = ToElementMesh[bmesh, 
   "RegionMarker" -> {{{0.1, sh/2}, 10, 0.001}, {{0.1, sh*2}, 20}}];
mesh["Wireframe"[
  "MeshElementStyle" -> {FaceForm[Green], FaceForm[Red]}]]

enter image description here

Now, we have element and boundary element markers. They can be used in the equation and/or in the boundary conditions:

er = If[ElementMarker == 
    10, {{11.7, 0.}, {0., 11.7}}, {{1., 0}, {0., 1.}}];
op = Inactive[Div][-er.Inactive[Grad][u[x, y], {x, y}], {x, y}] - 
   10^-8./8.86*^-12;
GD = {DirichletCondition[u[x, y] == 0, ElementMarker == 1],
   DirichletCondition[u[x, y] == 10^3, ElementMarker == 3]};
ufun = NDSolveValue[{op == 0, GD}, u, {x, y} \[Element] mesh];
(*ContourPlot[ufun[x,y],{x,y}\[Element]mesh,ColorFunction\[Rule]\
"TemperatureMap",AspectRatio\[Rule]Automatic]*)
  "MeshElementStyle" -> {FaceForm[Green], FaceForm[Red]}]]

To reformulate: Each element type (mesh, boundary and point elements) can have their own markers (and they can have the same value or not). That means if use use NeumannValue it will look at the markers in boundary elements and if you use a DirichletCondition it will look at markers in point elements. And if you use markers in an equation it will look at mesh element markers. This can be adopted to your problem at hand.

More information can be found in the ToBoundaryMesh ref page in the scope section and in the ElementMesh generation tutorial in the "Markers" section.

I'd be curious to see the resulting simulation.

$\endgroup$
6
  • $\begingroup$ Thank you for your reply. I am now quite convinced that the answer lies in the markers. I just could not understand from the documentation how exactly I should apply the ElementMarker option when dealing with Neumann boundary conditions. In the case of Dirichlet boundary conditions it seems quite easy, but does something like NeumannValue[5.,ElementMarker==3] work? These conditions are not supposed to be applied at a point, so I wonder if Mathematica applies the required condition in the region between two markers. $\endgroup$ Commented Oct 28, 2016 at 18:03
  • $\begingroup$ I think I found the answer to my own question: it seems that the markers, when applied to the boundaries, are associated with the line elements, and not with the point elements. In this case the Neumann boundary conditions should be applied like I mentioned in the previous comment. $\endgroup$ Commented Oct 28, 2016 at 18:28
  • $\begingroup$ I have updated the answer: Does that clarify things for you? Let me know then I can try to improve the documentation to make that clearer. $\endgroup$
    – user21
    Commented Oct 29, 2016 at 12:18
  • $\begingroup$ You answered my question correctly. As a bonus, I would like to see the potential in the region. Using Plot3D[solution[r, z], {r, 0, rmax}, {z, zmin, 5}, ColorFunction ->"Temperature"] I can see what I want, but ContourPlot[solution[r, z], {r, z} \[Element] mesh, ColorFunction -> "Temperature"]] gives the following error: ContourPlot::idomdim: {r,z}[Element]mesh does not have a valid dimension as a plotting domain. Here I found an identical (?) application (Input 36). $\endgroup$ Commented Nov 5, 2016 at 23:44
  • $\begingroup$ @Beubeu, that is a very unfortunate bug in 11.0.1 - it will be fixed in the next release. For now you can use MeshRegion[mesh]["MakeLinear"] in stead of mesh. Hope that helps. $\endgroup$
    – user21
    Commented Nov 6, 2016 at 10:37

Your Answer

By clicking “Post Your Answer”, you agree to our terms of service and acknowledge you have read our privacy policy.

Not the answer you're looking for? Browse other questions tagged or ask your own question.