4
$\begingroup$

A simple sample code

c0 = ContourPlot[x^2 + y^2 == 1, {x, -1, 1}, {y, -1, 1}, 
     PlotPoints -> 100, ContourShading -> False, 
     ContourStyle -> {Black, Thick}]

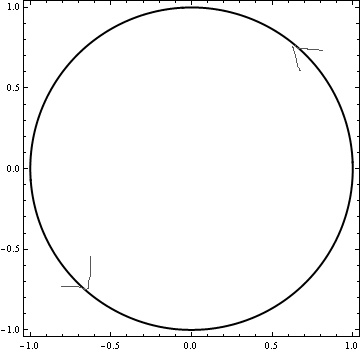
enter image description here

My question is how to add the two arrows indicated in the above plot? The position of the two arrows should not be random. One should be at an angle $\pi/4$ and the other at an angle $5\pi/4$. I should also be able to control the size, color and orientation of the arrows.

Any suggestions?

$\endgroup$

1 Answer 1

6
$\begingroup$

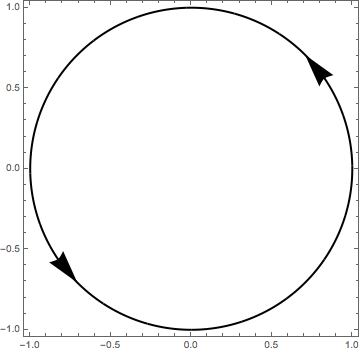
I would use a post-processing trick often shown off around here to change the Line object of the plot into Arrow objects:

c0 /. Line[x_] :> {Arrowheads[{{0.1, 3/8}, {0.1, 7/8}}], Arrow[x]}

gives

enter image description here

Edit - radius invariant positions

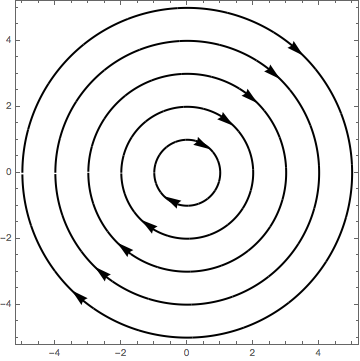
The reason the position of the arrows changes with radius is because sometimes the graphics created by ContourPlot are defined in a clockwise direction and sometimes an anticlockwise direction. The way to deal with this is to sort the points into a known direction. Thus:

rules = {GraphicsComplex[x_, y_] :> 
    GraphicsComplex[SortBy[x, ArcTan[#[[1]], #[[2]]] + (\[Pi]/2) &], 
    y /. Line[pts_] :> {Arrowheads[{{-0.1, 1/8}, {-0.1, 5/8}}], Arrow[pts]}]
  }

Show @@ Table[
  ContourPlot[x^2 + y^2 == r^2, {x, -r, r}, {y, -r, r}, 
  PlotPoints -> 100, ContourShading -> False, 
  ContourStyle -> {Black, Thick}] /. rules, {r, 5, 1, -1}]

enter image description here

$\endgroup$
5
  • $\begingroup$ Nice! But what if I want to with arrows a clockwise direction? $\endgroup$
    – Vaggelis_Z
    Commented Sep 28, 2016 at 11:16
  • 1
    $\begingroup$ If you look at the docs for ArrowHeads you can see how to change everything about the position, size orientation etc. To reverse the direction you want to specify a negative size so change the 0.1 to -0.1. reference.wolfram.com/language/ref/Arrowheads.html $\endgroup$ Commented Sep 28, 2016 at 11:22
  • $\begingroup$ If I change the radius of the circle then the positions of the arrows also change. Is there a way to obtain automatically the two arrows at $\pi/4$ and $5\pi/4$ for every radius and for every value of plot points? $\endgroup$
    – Vaggelis_Z
    Commented Sep 28, 2016 at 11:31
  • $\begingroup$ Yes. See the edit $\endgroup$ Commented Sep 28, 2016 at 11:54
  • $\begingroup$ Great! Many thanks! $\endgroup$
    – Vaggelis_Z
    Commented Sep 28, 2016 at 11:56

Your Answer

By clicking “Post Your Answer”, you agree to our terms of service and acknowledge you have read our privacy policy.

Not the answer you're looking for? Browse other questions tagged or ask your own question.