4
$\begingroup$

Here are some sample data

data3 = {{0, 2.9, 0.6}, {1, 1.8, 0.3}, {2, 0.52, -0.12}, {3, 0.69, 0.22},
         {4, 0.51, 0.45}, {5, 0.75, 0.67}, {6, -0.18, 1.29}, 
         {7, -1.56, 1.66}, {8, -1.05, 0.92}, {9, -0.3, 0.38}, 
         {10, -0.35, 0.07}, {11, 0.7, 1.15}, {12, -0.69, 0.45}, 
         {13, -1.15, 0.47}, {14, -0.65, -0.22}, {15, -0.15, -0.73}, 
         {16, 0.74, -1.07}, {17, 0.46759, -0.80989}};

Nt = Length[data3];
d3 = data3[[All, {2, 3}]];

Now let's make a nice plot with them

labels = Thread[
Range[Nt] -> (Placed[#, Above] & /@ 
  Join[{Subscript["P", 0]}, 
   Range[Nt - 2], {Subscript["L", "6"]}])];
labels = MapAt[Style[#, 18, Bold, FontFamily -> "Helvetica"] &, 
         labels, {All, 2, 1}];
plot = Show[
Graph[# \[DirectedEdge] # + 1 & /@ Range[Nt - 1], 
VertexCoordinates -> d3, VertexLabels -> labels, 
VertexStyle -> {1 -> Red, Nt -> Blue}], Frame -> True, 
Axes -> True, AxesStyle -> {Dashed, Dashed}, 
FrameLabel -> {"x", "y"}, RotateLabel -> False, 
LabelStyle -> Directive[FontFamily -> "Helvetica", 20], 
FrameTicks -> Automatic, AspectRatio -> 1, ImageSize -> 550, 
PlotRange -> {{-1.75, 3.1}, {-1.2, 1.95}}]

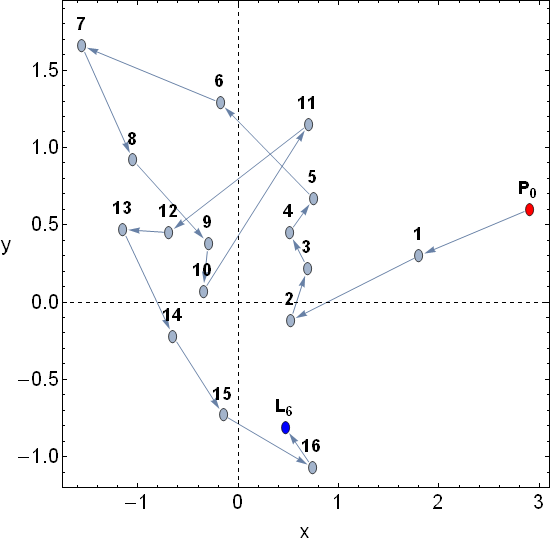
The output is the following

enter image description here

As you can see, there is something wrong with the points. In particular, all circular points are distorted and look like ellipses. This behavior is directly related with the PlotRange. If I set equal ranges to all axes then all points are fine. However I want to use this particular range.

So, how can I have nice circular points using the desired plot range?

Many thanks in advance!

$\endgroup$
1
  • 1
    $\begingroup$ This has more to do with AspectRatio; with VertexSize -> 0.03 {GoldenRatio, 1} you can counter the stretching of the plot caused by AspectRatio->1. $\endgroup$
    – corey979
    Commented Sep 20, 2016 at 17:55

2 Answers 2

5
$\begingroup$

This stretching is due to AspectRatio. Let's connect AspectRatio with VertexSize via defining ar:

ar = 1;
labels = Thread[
   Range[Nt] -> (Placed[#, Above] & /@ 
      Join[{Subscript["P", 0]}, 
       Range[Nt - 2], {Subscript["L", "6"]}])];
labels = MapAt[Style[#, 18, Bold, FontFamily -> "Helvetica"] &, 
   labels, {All, 2, 1}];
plot = Show[
  Graph[# \[DirectedEdge] # + 1 & /@ Range[Nt - 1], 
   VertexCoordinates -> d3, VertexLabels -> labels, 
   VertexStyle -> {1 -> Red, Nt -> Blue}, 
   VertexSize -> 0.04 {GoldenRatio ar, 1}], Frame -> True, 
  Axes -> True, AxesStyle -> {Dashed, Dashed}, 
  FrameLabel -> {"x", "y"}, RotateLabel -> False, 
  LabelStyle -> Directive[FontFamily -> "Helvetica", 20], 
  FrameTicks -> Automatic, AspectRatio -> ar, ImageSize -> 550, 
  PlotRange -> {{-1.75, 3.1}, {-1.2, 1.95}}]

For a few values of ar:

enter image description here

The value of 0.04 in VertexSize may be adjusted accordingly.

$\endgroup$
1
  • $\begingroup$ you can use Scaled here too.. VertexSize -> Scaled[{.02, .02}] $\endgroup$
    – george2079
    Commented Sep 20, 2016 at 18:51
4
$\begingroup$

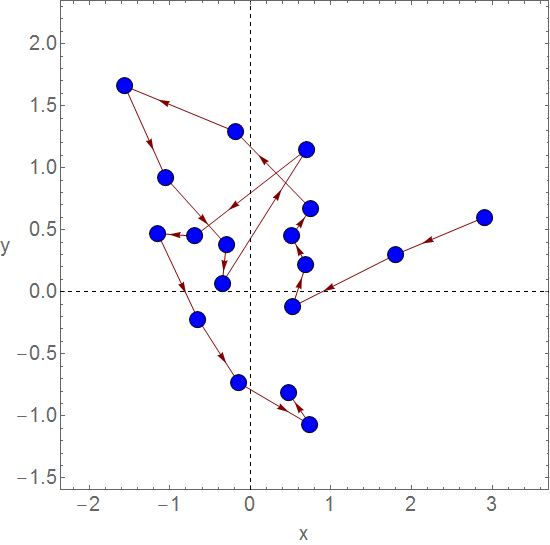
hopefully there is a better solution, but one way is to use GraphPlot and make the markers with Scaled[] aspect ratio, so that they end up being circles after Show imposes the aspect ratio.

labels = Thread[
   Range[Nt] -> (Placed[#, Above] & /@ 
      Join[{Subscript["P", 0]}, 
       Range[Nt - 2], {Subscript["L", "6"]}])];
labels = MapAt[Style[#, 18, Bold, FontFamily -> "Helvetica"] &, 
   labels, {All, 2, 1}];
plot = Show[
  GraphPlot[
   Graph[# \[DirectedEdge] # + 1 & /@ Range[Nt - 1], 
    VertexCoordinates -> d3, VertexLabels -> labels, 
    VertexStyle -> {1 -> Red, Nt -> Blue}], 
   VertexRenderingFunction -> ({Blue, EdgeForm[Black], 
       Disk[#, Scaled[{.015, .015}]]} &)], Frame -> True, 
  Axes -> True, AxesStyle -> {Dashed, Dashed}, 
  FrameLabel -> {"x", "y"}, RotateLabel -> False, 
  LabelStyle -> Directive[FontFamily -> "Helvetica", 20], 
  FrameTicks -> Automatic, ImageSize -> 550, 
  PlotRange -> {{-1.75, 3.1}, {-1.2, 1.95}}, AspectRatio -> 1]

enter image description here

note you could just use GraphPlot ( without Show ) and give GraphPlot all the frame directives. Same result though.

$\endgroup$
1
  • $\begingroup$ I think Scaled[] is the better solution. (I mean it seems intended to be used this way.) $\endgroup$
    – Michael E2
    Commented Sep 20, 2016 at 18:35

Your Answer

By clicking “Post Your Answer”, you agree to our terms of service and acknowledge you have read our privacy policy.

Not the answer you're looking for? Browse other questions tagged or ask your own question.