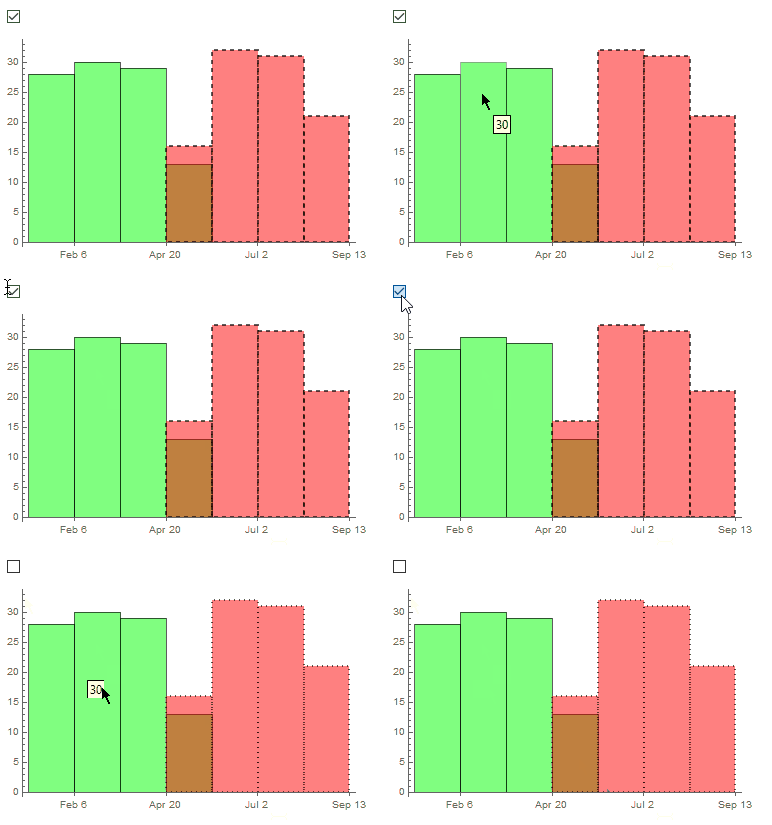
Let's say I have two samples:
data1 = RandomChoice[DateRange[{2010, 1, 1}, {2010, 4, 31}, "Day"], 100];
data2 = RandomChoice[DateRange[{2010, 5, 1}, {2010, 8, 31}, "Day"], 100];
I want to plot a histogram with both of them, and I want data2's bars to have Dotted or Dashed EdgeForm depending of a value of some variable, let's say t.
Problems with available styling options:
Dynamic @ DateHistogram[...], recreating it will be too slow for bigger samples.ChartStylecan't beDynamicor contain it in a list. It can haveDirectivesbut they can't containDynamiceither so it won't work as a wrapper.ChartElementFunctiondoes not allow to distinguish data samples.Histogram*allows certain wrappers for data, e.g.Style:Style[data2, Orange]but it won't allowDynamicinside
The only way I was able to use is a hairy postprocessing:
t = True; Checkbox @ Dynamic @ t

DateHistogram[
    {data1, data2}, ChartStyle -> {Green, Red}
] /. d_Directive :> Which[
   MemberQ[d, Red, ∞],
   Dynamic[
     Directive[##, EdgeForm[If[TrueQ[t], Dashed, Dotted]]]
   ] & @@ d
   ,
   True,
   d
]
Is there a more stable/generic way to achieve this?


Directives complicate post-processing too much. WhyDirectiveisn'tFlat?! I see no reason to keep nested structures ofDirectives. $\endgroup$DateHistogram(which I don't have) necessary for this example or could you be using aHistograminstead? $\endgroup$HistogramI can useHistogramListto assembleGraphicsby myself and have a full control. But forDateHistogramit is not possible :/ HistogramList for DateHistogram? $\endgroup$