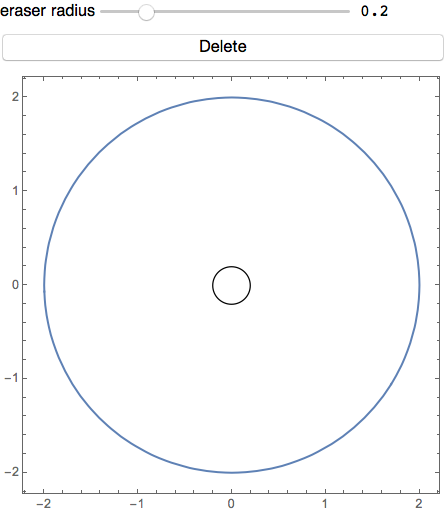
I recently had my interest peaked by the excellent thread "Exclude data from a list." In particular, the second answer which constructs an interactive eraser which allows one to delete data points in a ListPlot. For example,
data = Table[{RandomReal[{-10, 10}], RandomReal[{-10, 10}]}, {i, 1, 300}];
DynamicModule[{pt = {0, 0}, r = 3},
   Column[{Slider[Dynamic[r], {0.1, 5}],
   Button["Delete",
     data = Select[data, EuclideanDistance[#, pt] > r &]],
   LocatorPane[Dynamic[pt],
     Dynamic[
       ListPlot[data,
         Frame -> True,
         Axes -> False,
         AspectRatio -> 1,
         Epilog -> Circle[pt, r],
         ImageSize -> 300]],
      Appearance -> None]}]]
My question is, can one do something like this with ContourPlot? My idea was to make a contour plot, and then use Union to extract the data points, and plot them with ListPlot to apply the eraser:
F[x_, y_] := x^2 + y^2 - 4;

AB = Union[ContourPlot[{F[x, y] == 0}, {x, -3, 3}, {y, -3, 3}][[1, 1]]];
DynamicModule[{pt = {0, 0}, r = 3},
  Column[
    {Slider[Dynamic[r], {0.1, 5}],
     Button["Delete", AB = Select[AB, EuclideanDistance[#, pt] > r &]],
     LocatorPane[Dynamic[pt],
       Dynamic[ListPlot[AB,
         Frame -> True,
         Axes -> False,
         AspectRatio -> 1,
         Epilog -> Circle[pt, r],
         ImageSize -> 300]],
       Appearance -> None]}]]
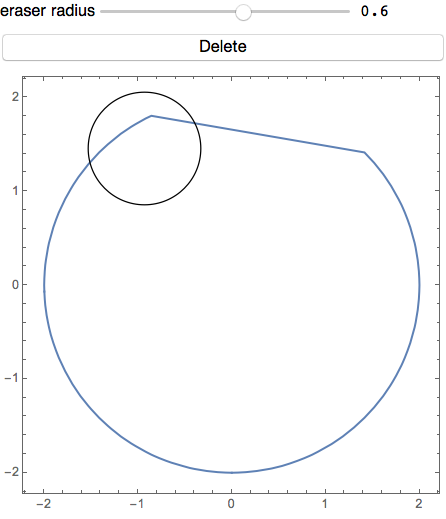
The problem with this attempt is that there's many gaps in the ListPlot. So does anyone know how to improve my awful method? Or perhaps is there another way to erase certain data points from a ContourPlot? If it helps, I don't care about collecting the resulting data points at all; this is purely about plotting a result.


Fis really the input then taking about erasing points doesn't make sense so much.ContourPlot[{F[x, y] == 0}, {x, -3, 3}, {y, -3, 3}, RegionFunction -> Function[{x, y}, EuclideanDistance[{x, y}, {2, 0}] > 1]]is something to start with, you can also take a look atImplicitRegion,RegionDifferenceand friends. $\endgroup$F[x, y] == 0represents an infinite set of points and usingSelectapproach with sample point representation you will lose precission quite quickly, as you noticed. $\endgroup$