6
$\begingroup$

I would like to do a 3D scatter plot with cross (x or +) markers instead of dots for each point. So far I'm using the following command:

p = ListPointPlot3D[points, PlotStyle -> Directive[Black, PointSize[0.01]]]

and it produces a proper 3D plot, but I can't find how to change the data markers from points to anything else (in my case, crosses). Is there a way to do that?

Thanks in advance!

$\endgroup$
1
  • 1
    $\begingroup$ Welcome to MSE. You could use Graphics3D, e.g. Graphics3D[Text["+", #] & /@ dat] where dat is your dataset $\endgroup$
    – ubpdqn
    Commented Aug 3, 2016 at 9:09

4 Answers 4

7
$\begingroup$

Alternatively to ubpdqn's suggestion, and in order to preserve the styling and default options of ListPointPlot3D I propose this solution:

ListPointPlot3D[RandomReal[10, {20, 3}]] /. Point -> Map[Text["+", #] &]

The trick is in this replacement rule:

/. Point -> Map[Text["+", #] &]
$\endgroup$
3
  • $\begingroup$ More generally, one can use Inset[]. $\endgroup$ Commented Aug 3, 2016 at 10:06
  • $\begingroup$ Perfect! Exactly what I was looking for, thank you! @LLlAMnYP : one more question, how could you then modify the color/size of the markers? $\endgroup$
    – Virginie
    Commented Aug 3, 2016 at 12:08
  • $\begingroup$ EDIT: I figured out that /. Point -> Map[Text[Style["+", Large, Bold, Red], #] &] does the trick $\endgroup$
    – Virginie
    Commented Aug 3, 2016 at 12:19
9
$\begingroup$

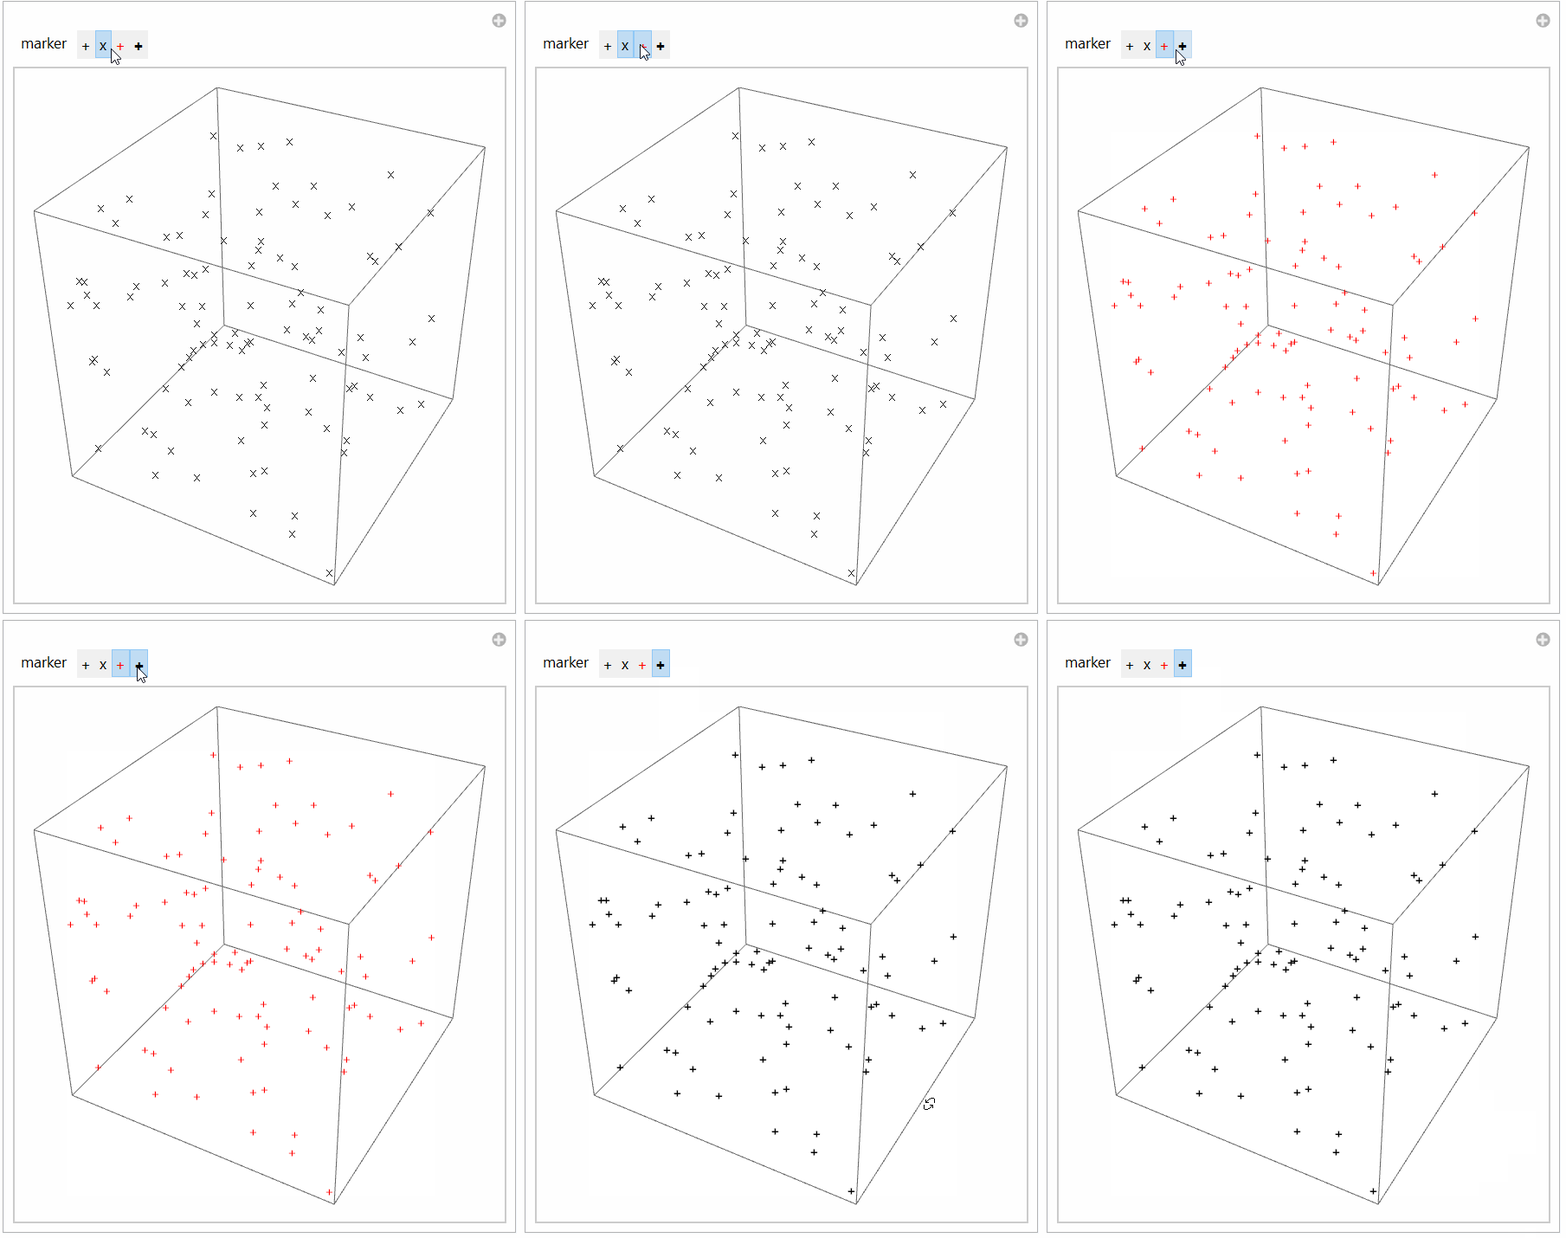
Just to illustrate:

Manipulate[
 Graphics3D[Text[marker, #] & /@ data],
 {marker, {"+", "x", Style["+", Red], Style["+", Bold]}}, 
 Initialization :> (data = RandomReal[1, {100, 3}])]

enter image description here

$\endgroup$
1
  • $\begingroup$ +1 for the "manipulate" command I just discovered. Thanks! $\endgroup$
    – Virginie
    Commented Aug 3, 2016 at 12:09
4
$\begingroup$
InputForm[ChemicalData["Methane", "MoleculePlot"]]
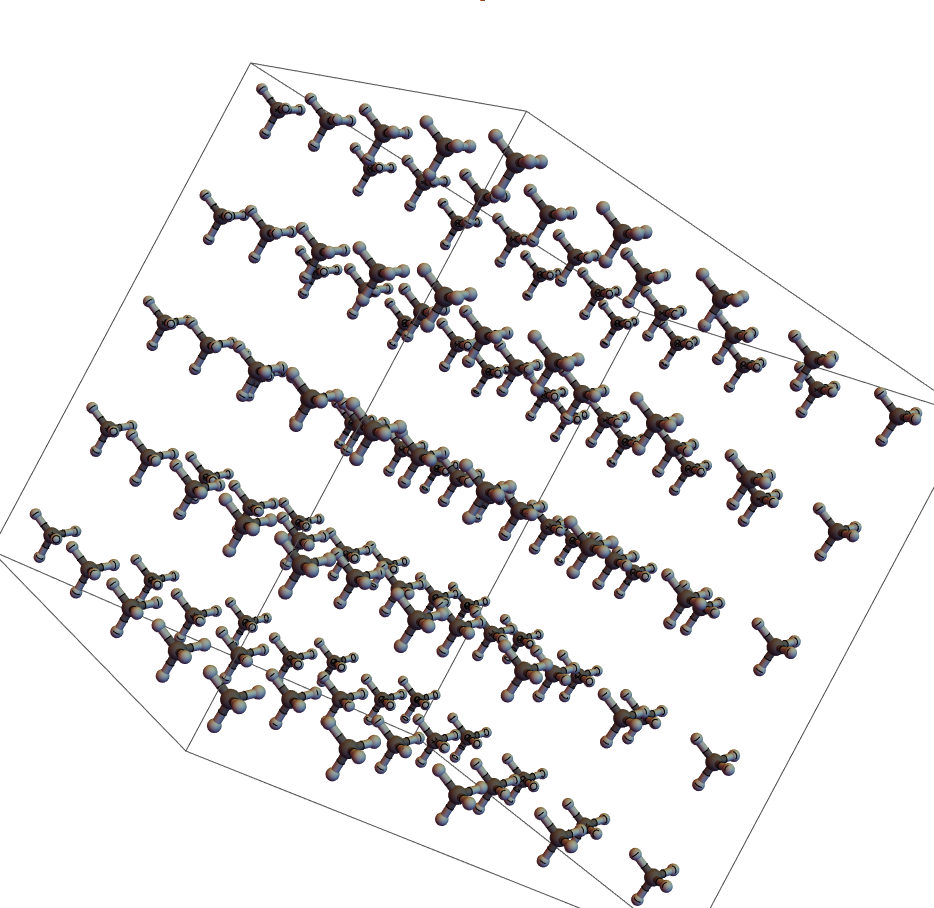
enter image description here

moleculePlot[poiints_] := Show[Graphics3D[
 {
  Translate[ 
     GraphicsComplex[
       {
        {0.0115361, -0.00644059, -0.0023318}, 
        {-6.98724, 109.314, 19.6968}, 
        {-53.4044, -24.1997, -94.6041}, 
        {-46.6211, -55.8814, 84.2109}, 
        {107.001, -29.2263, -9.30131}, 
        {-3.48785195, 54.653779705, 9.8472341},
        {-26.69643195, -12.103070295, -47.303215900000005}, 
        {-23.30478195, -27.943920295, 42.104284099999994}, 
        {53.50626805, -14.616370295, -4.651820900000001}}, 
       {
        {RGBColor[0.65, 0.7, 0.7], 
           Sphere[2, 24.],
           Sphere[3, 24.], 
           Sphere[4, 24.], 
           Sphere[5, 24.]
        }, 
         {RGBColor[0.4, 0.4, 0.4], 
           Sphere[1, 34.]}, 

         {RGBColor[0.65, 0.7, 0.7], 
           Cylinder[{6, 2}, 15.], 
           Cylinder[{7, 3}, 15.], 
           Cylinder[{8, 4}, 15.], 
           Cylinder[{9, 5}, 15.]}, 
         {RGBColor[0.4, 0.4, 0.4], 
           Cylinder[{1, 6}, 15.], 
           Cylinder[{1, 7}, 15.], 
           Cylinder[{1, 8}, 15.], 
           Cylinder[{1, 9}, 15.]}}], #]
       }
   ] & /@ (500*poiints)]

>

 somePoints = {{1, 1, 1}, {1, 1, 2}, {1, 1, 3}, {1, 1, 4}, {1, 1, 
5}, {1, 2, 1}, {1, 2, 2}, {1, 2, 3}, {1, 2, 4}, {1, 2, 5}, {1, 3, 
1}, {1, 3, 2}, {1, 3, 3}, {1, 3, 4}, {1, 3, 5}, {1, 4, 1}, {1, 4, 
2}, {1, 4, 3}, {1, 4, 4}, {1, 4, 5}, {1, 5, 1}, {1, 5, 2}, {1, 5, 
3}, {1, 5, 4}, {1, 5, 5}, {2, 1, 1}, {2, 1, 2}, {2, 1, 3}, {2, 1, 
4}, {2, 1, 5}, {2, 2, 1}, {2, 2, 2}, {2, 2, 3}, {2, 2, 4}, {2, 2, 
5}, {2, 3, 1}, {2, 3, 2}, {2, 3, 3}, {2, 3, 4}, {2, 3, 5}, {2, 4, 
1}, {2, 4, 2}, {2, 4, 3}, {2, 4, 4}, {2, 4, 5}, {2, 5, 1}, {2, 5, 
2}, {2, 5, 3}, {2, 5, 4}, {2, 5, 5}, {3, 1, 1}, {3, 1, 2}, {3, 1, 
3}, {3, 1, 4}, {3, 1, 5}, {3, 2, 1}, {3, 2, 2}, {3, 2, 3}, {3, 2, 
4}, {3, 2, 5}, {3, 3, 1}, {3, 3, 2}, {3, 3, 3}, {3, 3, 4}, {3, 3, 
5}, {3, 4, 1}, {3, 4, 2}, {3, 4, 3}, {3, 4, 4}, {3, 4, 5}, {3, 5, 
1}, {3, 5, 2}, {3, 5, 3}, {3, 5, 4}, {3, 5, 5}, {4, 1, 1}, {4, 1, 
2}, {4, 1, 3}, {4, 1, 4}, {4, 1, 5}, {4, 2, 1}, {4, 2, 2}, {4, 2, 
3}, {4, 2, 4}, {4, 2, 5}, {4, 3, 1}, {4, 3, 2}, {4, 3, 3}, {4, 3, 
4}, {4, 3, 5}, {4, 4, 1}, {4, 4, 2}, {4, 4, 3}, {4, 4, 4}, {4, 4, 
5}, {4, 5, 1}, {4, 5, 2}, {4, 5, 3}, {4, 5, 4}, {4, 5, 5}, {5, 1, 
1}, {5, 1, 2}, {5, 1, 3}, {5, 1, 4}, {5, 1, 5}, {5, 2, 1}, {5, 2, 
2}, {5, 2, 3}, {5, 2, 4}, {5, 2, 5}, {5, 3, 1}, {5, 3, 2}, {5, 3, 
3}, {5, 3, 4}, {5, 3, 5}, {5, 4, 1}, {5, 4, 2}, {5, 4, 3}, {5, 4, 
4}, {5, 4, 5}, {5, 5, 1}, {5, 5, 2}, {5, 5, 3}, {5, 5, 4}, {5, 5, 
5}};

>

moleculePlot[somePoints]
$\endgroup$
2
  • $\begingroup$ Nice, but hardly germane. $\endgroup$
    – LLlAMnYP
    Commented Aug 3, 2016 at 10:20
  • 2
    $\begingroup$ Quite creative but a little bit more bulky than what I was expecting :) $\endgroup$
    – Virginie
    Commented Aug 3, 2016 at 12:08
3
$\begingroup$

A variation of LLlAMnYP's method that performs better is to use Translate. Compare:

gr = ListPointPlot3D[ RandomReal[10, {8000, 3}] ];

gr /. Point -> Map[Text[Style["+", Bold, Red], #] &]

gr /. Point[x_] :> Translate[Style[Text["+"], Bold, Red], x]

On my system the first method takes 2.70 seconds to render, while the second takes only 0.08 second. Further interactive rotation of the second graphic will be found to be significantly smoother.

$\endgroup$

Your Answer

By clicking “Post Your Answer”, you agree to our terms of service and acknowledge you have read our privacy policy.

Not the answer you're looking for? Browse other questions tagged or ask your own question.