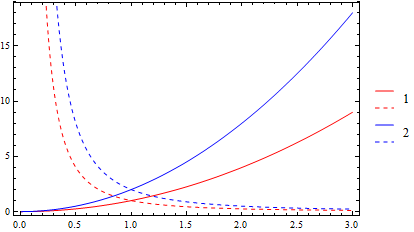
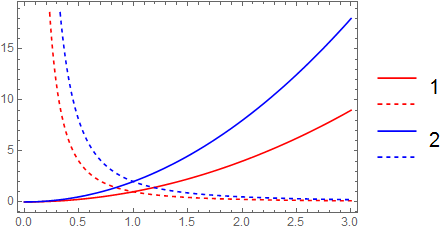
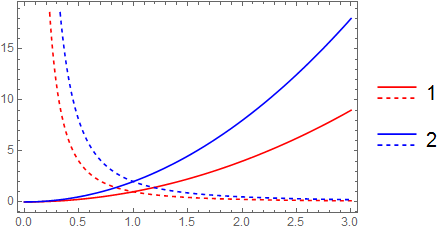
Consider the following code
styles = {Red, Blue, {Red, Dashed}, {Blue, Dashed}}
pt1 = Plot[{x^2, 2 x^2, 1/x^2, 2/x^2}, {x, 0, 3}, Frame -> True,
PlotStyle -> styles, PlotLegends -> {"1", "2", "1", "2"}]
I would like the two red lines to carry the same label "1" and the two blue lines the same label "2". That is, in the legend I would like a red line and a red-dashed line below each other and then one label right of it. Similarly for the blue lines. Does anybody know how to do this?


