3
$\begingroup$

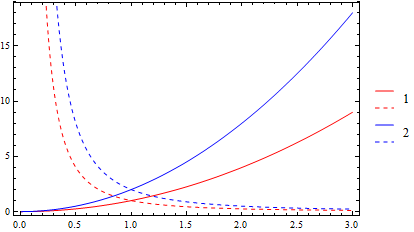
Consider the following code

styles = {Red, Blue, {Red, Dashed}, {Blue, Dashed}}
pt1 = Plot[{x^2, 2 x^2, 1/x^2, 2/x^2}, {x, 0, 3}, Frame -> True, 
PlotStyle -> styles, PlotLegends -> {"1", "2", "1", "2"}]

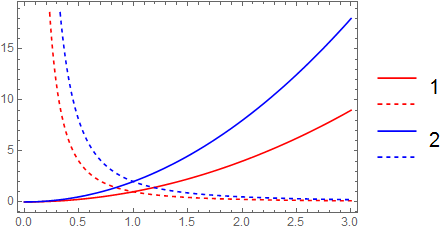
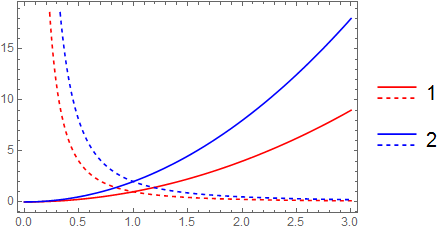
I would like the two red lines to carry the same label "1" and the two blue lines the same label "2". That is, in the legend I would like a red line and a red-dashed line below each other and then one label right of it. Similarly for the blue lines. Does anybody know how to do this?

$\endgroup$
2
  • 1
    $\begingroup$ Will you always have one solid and one dashed line for each group, or is that only an example? $\endgroup$
    – Mr.Wizard
    Commented Jul 14, 2016 at 8:33
  • $\begingroup$ @Mr.Wizard For what I need currently, they are always grouped together with two. However, I would be interested in knowing how the general case works. $\endgroup$
    – Funzies
    Commented Jul 14, 2016 at 8:35

2 Answers 2

7
$\begingroup$
ClearAll[table]
table[pairs_] := Module[{p = pairs}, p[[3, 2]] = SpanFromAbove; 
  p[[4, 2]] = SpanFromAbove; Grid[p[[{1, 3, 2, 4}]], Alignment -> {Center, Center}]]; 

styles = {Red, Blue, {Red, Dashed}, {Blue, Dashed}};
pt1 = Plot[{x^2, 2 x^2, 1/x^2, 2/x^2}, {x, 0, 3}, Frame -> True, 
  PlotStyle -> styles, 
  PlotLegends -> LineLegend[Automatic, {"1", "2", "1", "2"}, LegendLayout -> table]]

Mathematica graphics

$\endgroup$
3
  • $\begingroup$ I know I am nitpicking here, but is there any way to make the vertical spacing between the two red lines smaller, while keeping the distance between the dashed red and the solid blue line constant? $\endgroup$
    – Funzies
    Commented Jul 14, 2016 at 9:00
  • $\begingroup$ kglr, since we ended up with similar answers shall I edit yours to include my variation, and delete mine? $\endgroup$
    – Mr.Wizard
    Commented Jul 14, 2016 at 9:11
  • $\begingroup$ @Mr.Wizard, I think you should keep your answer; it is cleaner and also, addressing the spacing question, more complete. $\endgroup$
    – kglr
    Commented Jul 14, 2016 at 15:06
7
$\begingroup$

It looks like kglr beat me to it but I was also working on a LegendLayout method, so here it is.

styles = {Red, {Red, Dashed}, Blue, {Blue, Dashed}};

pair = (Grid[{Column @ #[[All, 1]], #[[1, 2]]} & /@ Partition[#, 2]] &);

Plot[{x^2, 1/x^2, 2 x^2, 2/x^2}, {x, 0, 3}, Frame -> True, 
  PlotStyle -> styles, 
  PlotLegends -> 
   LineLegend[styles, {"1", "1", "2", "2"}, 
    LegendLayout -> pair]]

enter image description here

I chose to reorder the expressions and styles as that seemed simpler to me, but I suppose a Transpose at the right point would have worked too.


Directly borrowing ideas from kglr's answer:

styles = {Red, {Red, Dashed}, Blue, {Blue, Dashed}};

pair = Grid[MapAt[SpanFromAbove &, #, {2 ;; ;; 2, 2}], 
    Alignment -> {Center, Center}, Spacings -> {1/2, {{1, -0.5}}}] &;

Plot[{x^2, 1/x^2, 2 x^2, 2/x^2}, {x, 0, 3}, Frame -> True, PlotStyle -> styles, 
 PlotLegends -> LineLegend[styles, {"1", "1", "2", "2"}, LegendLayout -> pair]]

enter image description here

$\endgroup$

Your Answer

By clicking “Post Your Answer”, you agree to our terms of service and acknowledge you have read our privacy policy.

Not the answer you're looking for? Browse other questions tagged or ask your own question.