7
$\begingroup$

Observe:

sr = 666;

d = PascalDistribution[1, 1/50];
od = OrderDistribution[{d, 10}, 1];

Column[{Mean[od] // N,
  SeedRandom[sr];
  Dimensions@(t1 = RandomVariate[d, {1000, 10}]),
  SeedRandom[sr];
  Dimensions@(t2 = Table[RandomVariate[d, 10], 1000]),
  SeedRandom[sr];
  Dimensions@(t3 = Partition[RandomVariate[d, 10000], 10]),
  SeedRandom[sr];
  Dimensions@(t4 = 
     ArrayReshape[Table[RandomVariate[d, 100], 100], {1000, 10}]),
  Min /@ t1 // Mean // N,
  Min /@ t2 // Mean // N,
  Min /@ t3 // Mean // N,
  Min /@ t4 // Mean // N}]

5.46666

{1000,10}

{1000,10}

{1000,10}

{1000,10}

5.463

6.484

5.463

5.463

The results from Min/@t...//Mean//N should be the same for all four cases.

Note the result (using the 666 seed) of 6.484 for the t2 case. This is consistently wacky (~+1 from actual expectation shown by the mean of the order distribution).

Changing the inner cardinality for the t4 case to anything 80 or above (e.g. ArrayReshape[Table[RandomVariate[d, 80], 125], {1000, 10}]keeps it consistent, but lowering it to say 50 in the RV generation results in also off-kilter results.

I'd venture there is some kind of heuristic switching of methods going on based on requested number of samples, and perhaps a bug in the low-count algorithm.

On 10.3 Windows, same results on 9.X Windows.

I'd appreciate verification (and explanation if I've pulled a DOH and there's a reason for this behavior).

$\endgroup$
3
  • $\begingroup$ Verified on 10.4.1, OS X $\endgroup$
    – vapor
    Commented Jun 29, 2016 at 7:31
  • $\begingroup$ You should report this to Wolfram. There is a build in switch. I'm using version 10.4.1 on Win 10. $\endgroup$
    – Karsten7
    Commented Jun 29, 2016 at 16:50
  • $\begingroup$ Another indication that this is a real bug is the fact that for NegativeBinomialDistribution RandomVariate is implemented in a very similar way (calling the same Statistics`BinomialDistributionsDump`* functions), but doesn't produce inconsistent results (at least not for the same parameters used in this question). $\endgroup$
    – Karsten7
    Commented Jun 30, 2016 at 10:39

3 Answers 3

3
$\begingroup$

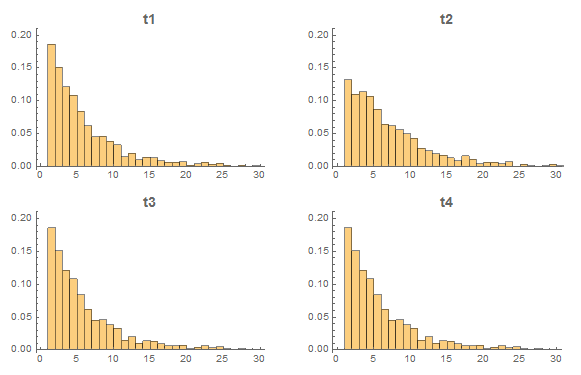
Just an extended comment: Rather than a consistent shift for the values in the minimum values for t2, it appears that the distribution is completely different than for t1, t3, and t4. Here's a figure showing that:

h[x_, label_] := Histogram[Min /@ x, {1}, "PDF", PlotRange -> {{0, 30}, {0, 0.20}}, 
  PlotLabel -> Style[label, Bold, Larger]]
GraphicsGrid[{{h[t1, "t1"], h[t2, "t2"]}, {h[t3, "t3"], h[t4, "t4"]}}, ImageSize -> Large] 

Histograms

$\endgroup$
1
  • $\begingroup$ Yes, the number I referred to was just for the expectation, histograms make it clear why. Seems like a bug to me, adding that tag, will have assistant report to WRI if they have time. $\endgroup$
    – ciao
    Commented Jun 29, 2016 at 22:31
2
$\begingroup$

In the t1 case

Random`DistributionVector[PascalDistribution[1, 1/50], 10000, ∞]

is evaluated and in the t2 case

Random`DistributionVector[PascalDistribution[1, 1/50], 10, ∞]

The definition of this function contains a Which statement. Its first test is True for 10000 and False for 10. Its second test (there are only two) is True.

For your parameters for the PascalDistribution the switch happens between 62 and 63.

$\endgroup$
1
$\begingroup$

This appears to be a bug.

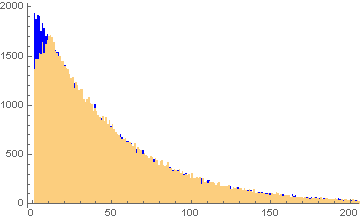
Histogram shows result of 100K RV on PascalDistribution[1,1/50] for 100k batch using RandomVariate[...,100000] (blue) and generating a table of 100k single calls (default chicken-poop-and-mud jaundice beige):

enter image description here

Thanks to Karsten for verification and Jim for histogram idea.

$\endgroup$
1
  • $\begingroup$ I had to smile at the choice of adjectives. :) $\endgroup$ Commented Jun 30, 2016 at 7:51

Your Answer

By clicking “Post Your Answer”, you agree to our terms of service and acknowledge you have read our privacy policy.

Not the answer you're looking for? Browse other questions tagged or ask your own question.