1
$\begingroup$

I have a data file containing the four orbital element $(x,y,p_x,p_y)$ of a two-dimensional closed loop orbit. Note that the exact implicit equation of the orbit is not known.

The plot of the 2D orbit on the $(x,y)$ plane

data = Import["lyap_4d.dat", "Table"];
d00 = data[[All, {1, 2}]];

C0 = ListLinePlot[d00, AspectRatio -> 1, PlotRange -> All, 
     Frame -> True, Axes -> False, PlotStyle -> {Black, Thick}]

enter image description here

Now let's define a rectangular grid of initial conditions around this orbit

data = Flatten[Table[{i, j}, {i, 0.785, 1.135, 0.005}, 
       {j, -0.45, 0.45, 0.005}], 1];
nic = Length[data]
L0 = ListPlot[data, PlotStyle -> {Blue, PointSize[0.001]}];
plot1 = Show[{L0, C0}]

enter image description here

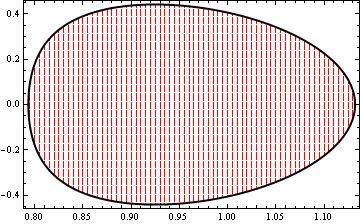
Finally, we determine which of the initial conditions are inside the orbit using the code provided here

poly = Cases[Normal@C0, Line[x_] :> x, Infinity];
inPolyQ[poly_, pt_] := Graphics`Mesh`PointWindingNumber[poly, pt] =!= 0
data2 = Select[data, inPolyQ[poly[[1]], #] &];
nic2 = Length[data2]
L1 = ListPlot[data2, PlotStyle -> {Red, PointSize[0.001]}];
plot2 = Show[{L1, C0}, Frame -> True, Axes -> False]

enter image description here

The list data2 contains all the $(x_0,y_0)$ initial conditions inside the orbit.

My question is the following: For the boundary orbit the $p_x$ and $p_y$ values are known. How can I use these values so as to predict in a way the $(p_{x0},p_{y0})$ of the orbits with initial conditions inside the orbit? In other words, how can I interpolate the $p_x$ and $p_y$ of the orbit by taking into account the values of the boundary?

I use version 9.0 of Mathematica in Win XP SP3.

Many thanks in advance!

$\endgroup$

1 Answer 1

3
$\begingroup$

You can make an interpolating function for both px and py from the data you have:

data = Import["Downloads/lyap_4d.dat", "Table"];
d00 = data[[All, {1, 2}]];
pyfunc = Interpolation[{{#1, #2}, #4} & @@@ data, 
   InterpolationOrder -> 1];
pxfunc = Interpolation[{{#1, #2}, #3} & @@@ data, 
   InterpolationOrder -> 1];

That answers the question of how to get the interpolated values inside the curve, but how can they be plotted?

In versions later than 10.0 you can make a plot of the momenta inside the curve very easily,

DensityPlot[pxfunc[x, y], {x, y} ∈ ConvexHullMesh[d00]]
DensityPlot[pyfunc[x, y], {x, y} ∈ ConvexHullMesh[d00]]

Mathematica graphics

But in version 9 you have to do it the hard way (borrowing from the answer here for the RegionFunction),

winding[poly_, pt_] := 
  Round[(Total@
       Mod[(# - RotateRight[#]) &@(ArcTan @@ (pt - #) & /@ poly), 
        2 Pi, -Pi]/2/Pi)];
testpoint[poly_, pt_] := 
  Round[(Total@
        Mod[(# - RotateRight[#]) &@(ArcTan @@ (pt - #) & /@ poly), 
         2 Pi, -Pi]/2/Pi)] != 0;

DensityPlot[
 pxfunc[x, y], {x, Min@d00[[All, 1]], Max@d00[[All, 1]]}, {y, 
  Min@d00[[All, 2]], Max@d00[[All, 2]]}, 
 RegionFunction -> Function[{x, y}, testpoint[d00, {x, y}]]]
DensityPlot[
 pyfunc[x, y], {x, Min@d00[[All, 1]], Max@d00[[All, 1]]}, {y, 
  Min@d00[[All, 2]], Max@d00[[All, 2]]}, 
 RegionFunction -> Function[{x, y}, testpoint[d00, {x, y}]]]

You can get the initial momenta for all your interior points via

data3 = {#1, #2, pxfunc[#1, #2], pyfunc[#1, #2]} & @@@ data2;
$\endgroup$
9
  • $\begingroup$ I do not want to plot them! Is it possible to obtain a new list, let's say, data3 with four columns $(x,y,p_x,p_y)$ for all the orbits inside the curve? $\endgroup$
    – Vaggelis_Z
    Commented Jun 23, 2016 at 14:02
  • $\begingroup$ How do you know if the orbits for conditions within your shape will also "close up", @Vaggelis? $\endgroup$ Commented Jun 23, 2016 at 14:04
  • 1
    $\begingroup$ @Vaggelis_Z - I believe I answered the question "how can I interpolate the $p_x$ and $p_y$ of the orbit by taking into account the values of the boundary?" As to how to go from the initial (px,py) values to orbits, that shouldn't be too hard to accomplish, but it's a different question entirely $\endgroup$
    – Jason B.
    Commented Jun 23, 2016 at 14:04
  • $\begingroup$ Indeed you answered the question and I will accept it. However the output is not the desired one. I want a new list data3 containing all four elements $(x,y,p_x,p_y)$. Could you add an update about it? $\endgroup$
    – Vaggelis_Z
    Commented Jun 23, 2016 at 14:11
  • $\begingroup$ @Vaggelis_Z - now for that I'm not sure offhand how to go about it. If you choose a random point in space, {x0, y0} that is inside the orbit given, then you can use your interpolating function here to get some initial momenta {px0,py0}, but I can't say what the dynamics following that would be just based on the data from one orbit. You need to add in some equations of motion, and then use NDSolve or something similar to get the orbit from the initial conditions... $\endgroup$
    – Jason B.
    Commented Jun 23, 2016 at 14:18

Your Answer

By clicking “Post Your Answer”, you agree to our terms of service and acknowledge you have read our privacy policy.

Not the answer you're looking for? Browse other questions tagged or ask your own question.