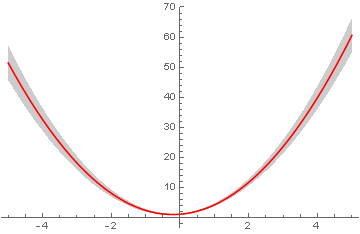
Let's assume I want to plot the function $f(x)=a + bx+ cx^{2}$, where experimentally known values of parameters $a, b$ and, $c$ are as follows:
$a=1.01 \pm 0.18$
$b=0.92 \pm 0.11$
$c=2.2 \pm 0.2$
In the absence of uncertainties, we should have a thin curve which is trivial to plot. However, the thickness of the curve will increase depending on the amount of uncertainties. Is there any way to plot such a function with the corresponding "confidence bands" in Mathematica 8.0?


Plot[With[{w = Interval[1.01 + 0.18 {-1, 1}] + x (Interval[0.92 + 0.11 {-1, 1}] + x Interval[2.2 + 0.2 {-1, 1}])}, {Min[w], Max[w]}], {x, -5, 5}]and report back. $\endgroup$