17
$\begingroup$

I would like to plot an expression (like TreeForm does), but using the new TreeGraph functionality.

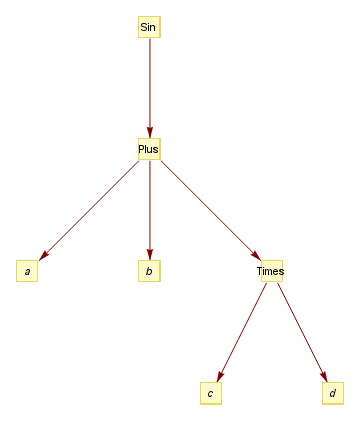
TreeGraph takes as input a set of edges (of the form a -> b), so it seems that to solve the problem it is necessary to turn an expression into a set of edges. For example Sin[Plus[a, b]] would need to be transformed into: {Sin -> Plus, Plus -> a, Plus -> b}.

How can this transformation be done for any Mathematica expression? Thanks!

$\endgroup$
5
  • $\begingroup$ Welcome to Mathematica.SE, scaramouche! Please consider registering your account so that any upvotes you get on this question are added to those you might get on future questions and answers. That way, over time you will be able to do more on the site (post graphics, edit things, do the fandango...). I also formatted your code for you. Here's a guide to show you how for next time. $\endgroup$
    – Verbeia
    Commented Oct 3, 2012 at 5:27
  • $\begingroup$ +Very good challenge! $\endgroup$
    – DavidC
    Commented Oct 3, 2012 at 5:43
  • $\begingroup$ Why do you want to do this? Any advantage in using TreeGraph instead of TreeForm? $\endgroup$
    – Jepessen
    Commented Oct 3, 2012 at 7:29
  • 4
    $\begingroup$ @Jepessen Output of TreeForm produces just graphics. Output of TreeGraph gives a Graph object which carries complete information about graph and can be computed with. $\endgroup$ Commented Oct 3, 2012 at 8:57
  • 1
    $\begingroup$ Have you seen this stackoverflow.com/a/5649473/353410? $\endgroup$ Commented Oct 3, 2012 at 9:37

2 Answers 2

8
$\begingroup$

Method starts off by replacing all heads in the expression with the appropriate node index, then deduces the edge list by parsing the substituted node-index-expression. Note that input expression must be wrapped in Hold (or HoldComplete) to prevent evaluation of e.g. Plus[1, 2] into 3.

(* sow node -> label replacements *)
sowLabel[x_?AtomQ] := (Sow[# -> x]; #) &[c++];
sowLabel[x_] := x;

(* sow parent -> child replacements *)
sowEdge[head_[arg__]] := (Sow[head -> #] & /@ {arg}; head);
sowEdge[x_?AtomQ] := x;

(* the expression to be parsed into a tree *)
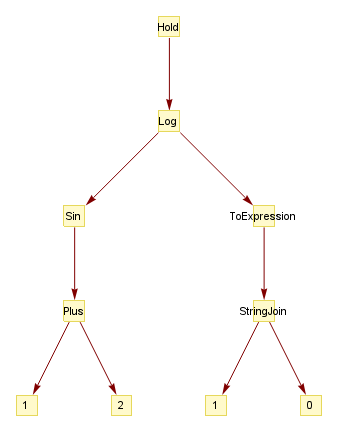
expr = Hold[Log[Sin[1 + 2], ToExpression["1" <> "0"]]];
FullForm@expr
Hold[Log[Sin[Plus[1, 2]], ToExpression[StringJoin["1", "0"]]]]
(* replace heads with node index & collect index -> label list *)
c = 1;
{new, labels} = Reap@ReleaseHold@Map[sowLabel, expr, {2, \[Infinity]}, Heads -> True]
{
  1[2[3[4, 5]], 6[7[8, 9]]],
  {{1 -> Log, 2 -> Sin, 3 -> Plus, 4 -> 1, 5 -> 2, 6 -> ToExpression, 7 -> StringJoin, 8 -> "1", 9 -> "0"}}
}
(* create graph edges from substituted expression *)
edges = Sort@Most@First@Last@Reap@Map[sowEdge, {new}, {0, \[Infinity]}]
{1 -> 2, 1 -> 6, 2 -> 3, 3 -> 4, 3 -> 5, 6 -> 7, 7 -> 8, 7 -> 9}
(* plot results *)
{
 TreeGraph[edges,
  VertexLabels -> First@labels, ImagePadding -> {{1, 35}, {0, 10}}
  ],
 LayeredGraphPlot[edges,
  VertexLabeling -> True,
  VertexRenderingFunction :> (Inset[
      Framed[InputForm[#2 /. First@labels], Background -> Hue[.15, .3, 1]], #1] &)
  ],
 TreeForm[expr, ImageSize -> 230]
 }

Mathematica graphics

Hold[Log[Sin[Plus[1, 2]], ToExpression[StringJoin["1", "0"]]]]

Note, that TreeForm keeps the Hold wrapper.

$\endgroup$
2
  • $\begingroup$ Many thanks István. You solution using TreeGraph is almost what I need. But it has a problem: TreeGraph chooses by itself which node should be the root. So, for example, if you try the expression Sin[Plus[a,b]], it will place Plus at the top (when it should be Sin). Is there a way to fix the root of the tree? $\endgroup$ Commented Oct 3, 2012 at 21:32
  • 2
    $\begingroup$ @scaramouche: Yes, I am aware of it, that's why I suggested using LayeredGraphPlot instead. If you insist on TreeGraph, you can extract VertexCoordinates from the LayeredGraphPlot and lay out the TreeGraph using them. Further discussion here. $\endgroup$ Commented Oct 3, 2012 at 22:31
2
$\begingroup$

You can also use GraphComputation`ExpressionGraph and post-process the EdgeList of the graph produced by GraphComputation`ExpressionGraph

edgeList = EdgeList @ # /. PropertyValue[#, VertexLabels]&;

Examples:

eg1 = GraphComputation`ExpressionGraph[Sin[Plus[a, b, Times[c,d]]]];

edgeList @ eg1 

{Sin -> Plus, Plus -> TagBox["a",HoldForm], Plus -> TagBox["b", HoldForm], Plus-> Times, Times-> TagBox["c", HoldForm], Times-> TagBox["d", HoldForm]}

% /. TagBox -> (# &)

{Sin -> Plus, Plus -> "a", Plus -> "b", Plus -> Times, Times -> "c", Times -> "d"}

Istvan's example:

eg2 = GraphComputation`ExpressionGraph[Hold[Log[Sin[1 + 2], ToExpression["1"<>"0"]]]];

edgeList @ eg2 

{Hold->Log, Log -> Sin, Sin -> Plus, Plus -> TagBox[1, HoldForm], Plus -> TagBox[2, HoldForm], Log -> ToExpression, ToExpression -> StringJoin, StringJoin -> TagBox["1", HoldForm], StringJoin -> TagBox["0", HoldForm]}

% /. TagBox -> (# &)

{Hold -> Log, Log- > Sin, Sin -> Plus, Plus -> 1, Plus -> 2, Log -> ToExpression, ToExpression -> StringJoin, StringJoin -> "1", StringJoin -> "0"}

With a helper function to put the vertex labels in the centers:

reStyle = SetProperty[#, {GraphStyle -> "VintageDiagram", VertexLabels -> 
 (PropertyValue[# , VertexLabels]/. HoldPattern[a_-> b_]:>Rule[a, Placed[b, Center]])}]&;

reStyle @ eg1

enter image description here

reStyle @ eg2

enter image description here

$\endgroup$

Your Answer

By clicking “Post Your Answer”, you agree to our terms of service and acknowledge you have read our privacy policy.

Not the answer you're looking for? Browse other questions tagged or ask your own question.