1
$\begingroup$

I wrote this code:

ClearAll[t]
 n = 4;
t[0] = 0;
t[n] = 1;
h = N[(t[n] - t[0])/n, 2];
Do[t[L + 1] = t[L] + h;, {L, 0, n - 1}]
 A[0][t_] := 
 Piecewise[{{1 - (t - t[0])/(t[1] - t[0]), t[0] <= t <= t[1]}}] 
A[k_][t_] := 
  Piecewise[{{(t - t[k - 1])/(t[k] - t[k - 1]), 
     t[k - 1] <= t <= t[k]}, {1 - (t - t[k])/(t[k + 1] - t[k]), 
     t[k] <= t <= t[k + 1]}}];
A[n][t_] := 
  Piecewise[{{(t - t[n - 1])/(t[n] - t[n - 1]), 
     t[n - 1] <= t <= t[n]}}];
Plot[Evaluate[A[#][t] & /@ Range[0, n]], {t, 0, 1}, 
 PlotRange -> {0, 1}, PlotLegends -> "Expressions"]

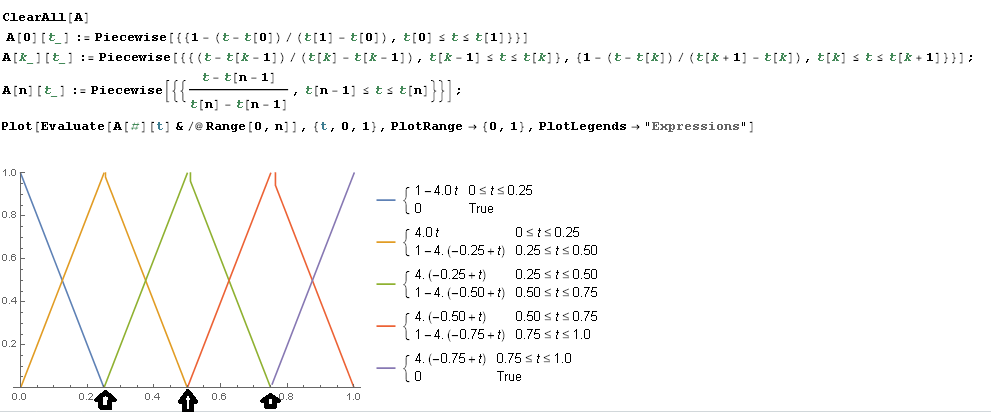
I want to have scale in distance for Piecewise, for example in the following picture

enter image description here

$\endgroup$
2
  • $\begingroup$ Assuming you want to add ticks at the indicated places, use the option Ticks -> {t /@ Range[0, n], Automatic} $\endgroup$
    – kglr
    Commented Apr 25, 2016 at 16:54
  • $\begingroup$ Many many thanks. $\endgroup$
    – bahram
    Commented Apr 25, 2016 at 17:00

2 Answers 2

2
$\begingroup$
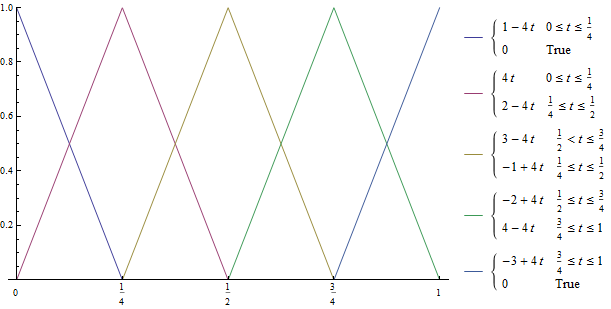
  • Changed h = N[(t[n] - t[0])/n, 2]; to h = (t[n] - t[0])/n;
  • Changed Piecewise[...] to Simplify@Piecewise[...], and
  • Used t /@ Range[0, n] as horizontal axis ticks:

With these changes:

 Plot[Evaluate[A[#][t] & /@ Range[0, n]], {t, 0, 1}, 
     PlotRange -> {0, 1}, PlotLegends -> "Expressions", 
     Ticks -> {t /@ Range[0, n], Automatic}]

Mathematica graphics

Use Ticks -> {{#, N[#, 2]} & /@ t /@ Range[0, n], Automatic} if you want tick labels as decimal numbers.

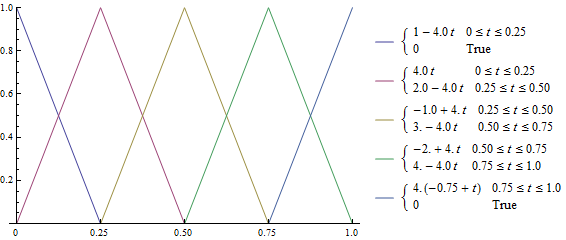
Without the change in the definition of h we get:

Mathematica graphics

$\endgroup$
3
  • $\begingroup$ Many thanks, but I use this code:` Plot[Evaluate[A[#][t] & /@ Range[0, n]], {t, 0, 1}, PlotRange -> {0, 1}, PlotLegends -> "Expressions", Ticks -> {{#, N[#, 3]} & /@ t /@ Range[0, n]}] ` and I do not have decimal numbers in PlotLegends. $\endgroup$
    – user37694
    Commented Apr 27, 2016 at 8:27
  • $\begingroup$ @user37694, it could be due to version difference; i am using v9. $\endgroup$
    – kglr
    Commented Apr 27, 2016 at 8:36
  • $\begingroup$ I am using v10. $\endgroup$
    – user37694
    Commented Apr 29, 2016 at 13:20
2
$\begingroup$

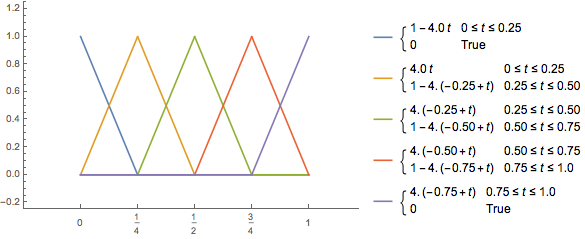
Have a look at AxesOrigin and FindDivisions

Plot[Evaluate[A[#][t] & /@ Range[0, n]]
, {t, 0, 1}
, PlotRange -> {{-.25, 1.22}, {-.25, 1.25}}
, AxesOrigin -> {-.25, -.25}
, Ticks -> {FindDivisions[{0, 1}, 4], Automatic}
, PlotLegends -> "Expressions"]

enter image description here

$\endgroup$

Your Answer

By clicking “Post Your Answer”, you agree to our terms of service and acknowledge you have read our privacy policy.

Not the answer you're looking for? Browse other questions tagged or ask your own question.