1
$\begingroup$

I have an expression with lots of variables, and I would like to make several plots of the expression, where the axis in each is a different variable. The idea is to put them side by side inside a Manipulate structure that lets me move around the values of the rest. But I am having problems with order of evaluation, because sometimes the value of x gets substituted in before Plot gets a hold of it.

Here is an example. Let's say my expression is x^y. The following code works perfectly, and is an example of what I am trying to make more modular:

Manipulate[
 GraphicsRow[{
   Plot[x^y, {x, .1, 2}, AxesLabel -> {"x"}] , 
   Plot[x^y, {y, .1, 2}, AxesLabel -> {"y"}] }],
 {x, .1, 2}, {y, .1, 2}]

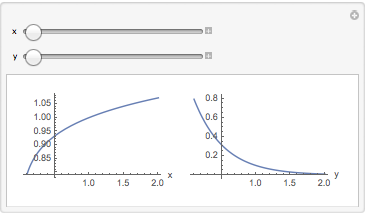
working non-modular plots

It works, I believe, because the first Plot looks for its variable x and scopes the x in x^y as local (something like FE`x$$1010 before Manipulate gets to substitute in the value from the slider. (Is this right?)

Now, in my application, the expressions to be plotted, and the variables and range against which to plot, are more dynamic. Here is my failed attempt at this:

With[{exprsToPlot = {x^y, x^y}, 
      plotRangeSpecs = {{x, .1, 2}, {y, .1, 2}}}, 
  Manipulate[
    MapThread[Plot,  {exprsToPlot, plotRangeSpecs}],
    {x, .1, 2}, {y, .1, 2}  ] ]

non-working modular plots

(I left out the AxesLabel because I'd first like to get the basic piece to work, though if any solution-writer wants to make that and other plot options work, I'd be impressed.)

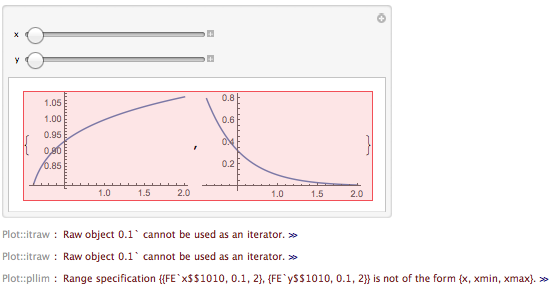
I also tried using Thread instead of MapThread, which actually mostly works, while throwing errors:

With[{exprsToPlot = {x^y, x^y}, 
    plotRangeSpecs = {{x, .1, 2}, {y, .1, 2}}}, 
  Manipulate[  Thread[Plot[exprsToPlot, plotRangeSpecs]]

enter image description here

I think the solution involves holding the variable to plot (x and y respectively) but not the others, I haven't been able to implement this. I tried to make my own version of MapThread with the attribute HoldAll, but that won't do because the variables other than the x-axis ones (y and x, respectively) do need to be substituted for their values from the sliders before Plot gets a hold of them.

It would be ideal if the solution could take named arguments in a list too, as in setting plotLabels={"title1", "title2"}, and having plotLabels be another list argument passed to Plot. But Thread isn't set up to deal with named arguments, as far as I know.

Also, in my example I plotted the same x^y in both figures, but in general the entries of exprsToPlot may not be the same.

$\endgroup$
2
  • $\begingroup$ I don't understand what you are trying to accomplish. What exactly do you want to manipulate? The range of the x variable? Could you describe in words what you would like the manipulate to allow you to change? $\endgroup$
    – MarcoB
    Commented Apr 2, 2016 at 7:16
  • $\begingroup$ I would like to take different "slices" of a multidimensional function. Suppose it was f(x,y,z) (3 dimensions). I'd like to use the Manipulate sliders to pick a base point (x0,y0,z0) and have plots showing what happens to the value of f as the argument is varied in each of several dimensions (perhaps just x and y, if those are the only variables of interest). In my application there are more like 10 arguments and I want to see plots of 3 or so of them. $\endgroup$
    – Seth
    Commented Apr 2, 2016 at 18:09

3 Answers 3

4
$\begingroup$

From the OP comments the slices (or contours) of a multi-dimensional function is what is being sought.

A way to do this is the have each Plot in Manipulate set as Dynamic on the variables not on the x-axis. Such that, as these variables are adjusted the contour in the variable on the x-axis updates.

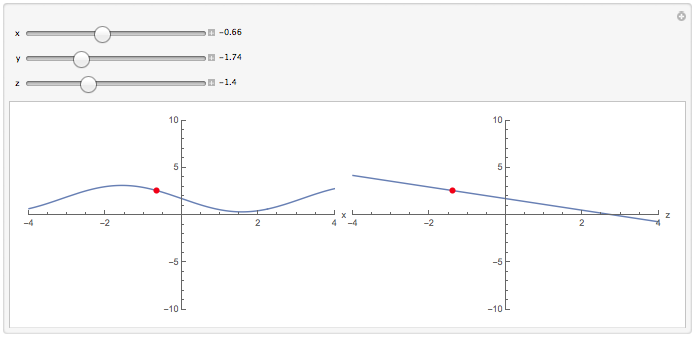
For example, for $f(x,y,z) =z\sin(x)-y$ the contours in $x$, $y$, and $z$ can be obtained from:

Manipulate[
 Row[
  Plot[Last@#, {var, -4, 4},
      PlotRange -> {{-4, 4}, {-10, 10}},
      ImageSize -> Medium,
      Epilog -> {Red, PointSize[.02], Point[{First@#, f[x, y, z]}]}] &
   /@ {{x, f[var, y, z]}, {y, f[x, var, z]}, {z, f[x, y, var]}}
  ],
 Evaluate[
  Sequence @@ ({#, -4, 4, Appearance -> "Labeled"} & /@ {x, y, z})],
 Initialization :> {f[x_, y_, z_] := z Sin[x] - y}]

enter image description here

Hope this helps.

$\endgroup$
1
  • $\begingroup$ The red dot is a nice touch. I accepted this answer, but then also wrote a bit more to make it easier to switch the function and the specification of plots, so I posted that as another answer. $\endgroup$
    – Seth
    Commented Apr 4, 2016 at 4:06
3
$\begingroup$

As you've noticed both Plot and Manipulate are scoping constructs. And the problem is that you want to manipulate expressions that contain variables which are meant to be scoped and where is a naming conflict.

What you want probably is possible but I think the fastest solution is just to avoid naming conflicts:

With[{
  exprsToPlot = {xp^y, x^yp},
  plotRangeSpecs = {{xp, .1, 2}, {yp, .1, 2}}},
 Manipulate[
  MapThread[Plot, {exprsToPlot, plotRangeSpecs}], 
  {x, .1, 2}, {y, .1, 2}
 ]
]
$\endgroup$
1
  • $\begingroup$ Kuba, this is more sensible than figuring out how to do the scoping properly, and it does solve my problem. I will leave the question open for now in hopes of learning the "right" way to do it. $\endgroup$
    – Seth
    Commented Apr 2, 2016 at 23:37
0
$\begingroup$

Both Edmund's and Kuba's answers provided the key, which was just to substitute a different variable (like var or xp) that Manipulate won't touch. With that key, I created something more modular, using a Module structure to specify just once at the top which plots to make:

ClearAll[f];
Module[{vars, varsAsPattern, varsToPlot, varFnSeq},
 vars = {x, y, z};         (*input to fn f*)
 varsToPlot = {x, z}; (*which Plots to make*)

 varsAsPattern = Sequence @@ (Pattern[#, _] & /@ vars);
 varFnSeq = 
  Table[{thisVar, ToString@thisVar, vars /. thisVar -> var},
    {thisVar, varsToPlot}];

 With[
  {vars = vars, varFnSeq = varFnSeq, varsAsPattern = varsAsPattern},
  Manipulate[
   Row[
    Function[{input},
      Plot[f @@ (Last@input), {var, -4, 4},
       PlotRange -> {{-4, 4}, {-10, 10}},
       ImageSize -> Medium,
       AxesLabel -> List@input[[2]],
       Epilog -> {Red, PointSize[.02], Point[{First@input, f @@ vars}]}  ]]
     /@ varFnSeq  ] ,
   Evaluate[
    Sequence @@ ({#, -4, 4, Appearance -> "Labeled"} & /@ vars)],
   Initialization :> {f[varsAsPattern] := z Sin[x] - y}
   ] ]  ]

the resulting display

A few points about this:

  • The idea is to specify which plots to make just once at the top, with varsToPlot.
  • This leaks the function f, as does the original solution.

About why I wrote it this way:

  • The With[{vars=vars, ...}, ...] structure ensures that those expressions are substituted in before any other evaluation happens. (I can't find a reference for this usage, but this is a good starting point.)
  • Creating varsAsPattern (the sequence x_, y_, z_ in this case) allows f to be initialized below without passing any variable like x that Manipulate will try to substitute into.
  • I used the Function[{input}, ...] structure because using slots (#) led to errors once I wrote List@ #[[2]].
  • While writing this, sometimes editing it would give errors of unmatched braces, and a fix was to delete then re-type the closing ] corresponding to Row[. Weird.

It shouldn't be too difficult to further extend this into a function. And in fact it may be easier because you could define the function f , rather than initialize it at the bottom based on an expression (so no need for varsAsPattern).

$\endgroup$

Your Answer

By clicking “Post Your Answer”, you agree to our terms of service and acknowledge you have read our privacy policy.

Not the answer you're looking for? Browse other questions tagged or ask your own question.