16
$\begingroup$

For a ellipse $E(\theta)$, which owns the parametric equation as follows:

$\begin{cases} x = a \sin\theta + b \cos\theta + c \\ y = d \sin\theta + e \cos\theta + f \\ \end{cases}$

Now, I have a point $P=\{x_p,y_p\}$, to know the relationship between $E(\theta)$ and $P=\{x_p,y_p\}$, I using this method:

$$ \begin{cases} \sin \theta =\frac{(c-x_p)e+b(y_p-f)}{b d-a e}\\ \cos \theta =\frac{(-c+x_p)d+a(f-y_p)}{b d-a e} \end{cases} $$

compute $m=\sin^2 \theta+\cos^2 \theta$

  • if $m=1$, the point $P$ on the ellipse $E(\theta)$
  • if $m>1$, the point $P$ outside the ellipse $E(\theta)$
  • if $m<1$, the point $P$ inside the ellipse $E(\theta)$

However, for the compound curve, for example

  • ellipse segment $E_1(\theta) \qquad \theta \in [0, 2.4798],[5.8629, 2 \pi]$

  • ellipse segment $E_2(\theta) \qquad \theta \in [3.1275, 6.1325]$

  • line segment $L(E_1(2.4798),E_2(3.1275))$


mat1 = {{0., -5., 0}, {-5.2203, 0., 1.7945}}; 
mat2 = {{-0.8583, -4.9384, 0.1765}, {-5.4189, 0.7822, 2.3088}};
θ1 = 2.4798;
θ2 = 3.1275;
Show[
  {ParametricPlot[
     mat1.{Sin[θ], Cos[θ], 1}, {θ, 0, 2.4798}, PlotStyle -> Red], 
   ParametricPlot[
     mat1.{Sin[θ], Cos[θ], 1}, {θ, 5.8629, 2 Pi}, PlotStyle -> Red],
   ParametricPlot[
     mat2.{Sin[θ], Cos[θ], 1}, {θ, 3.1275, 6.1325}],
   Graphics[
     {Line[{mat1.{Sin[θ1], Cos[θ1], 1}, mat2.{Sin[θ2], Cos[θ2], 1}}]}]}, 
  PlotRange -> All]
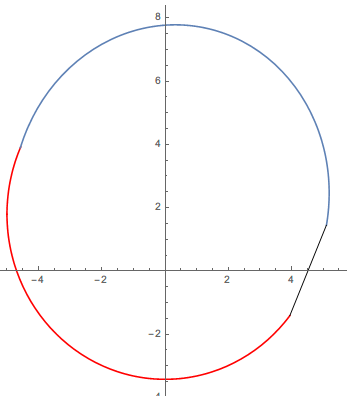
enter image description here

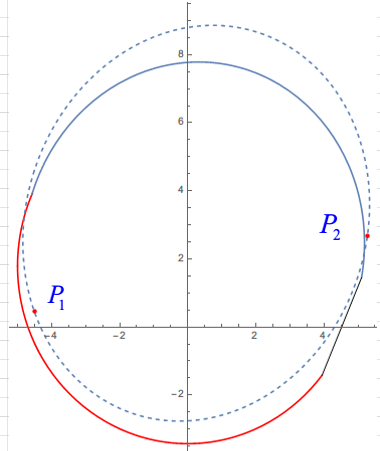
Now, I have two points $P_1,P_2$, whose coordinate are {{-4.50722, 0.455707}, {5.2748, 2.68502}},respectively.So I would like to know is there a simple method to determine whether $P$ inside the boundary?
enter image description here

$\endgroup$
3
  • 3
    $\begingroup$ Can't you use RegionMember? $\endgroup$
    – RunnyKine
    Commented Mar 26, 2016 at 6:04
  • 4
    $\begingroup$ if performance is important, the fastest and most precise approach I suspect will be to use FindRoot to find where/if each segment intersects a line from P to (Infinity,Py). Then just count the roots, odd->inside $\endgroup$
    – george2079
    Commented Mar 26, 2016 at 11:55
  • $\begingroup$ @george2079 Could you give me a explanation about (Infinity,Py)? Thanks:) $\endgroup$
    – xyz
    Commented Mar 26, 2016 at 14:52

6 Answers 6

16
$\begingroup$

One way you can do this is to first discretize the graphics, then turn it into a region with an interior using DelaunayMesh, and finally using RegionMember:

mat1 = {{0., -5., 0}, {-5.2203, 0., 1.7945}}; 
mat2 = {{-0.8583, -4.9384, 0.1765}, {-5.4189, 0.7822, 2.3088}};
θ1 = 2.4798;
θ2 = 3.1275;
gr=
 Show[
  {ParametricPlot[
     mat1.{Sin[θ], Cos[θ], 1}, {θ, 0, 2.4798}, PlotStyle -> Red], 
   ParametricPlot[
     mat1.{Sin[θ], Cos[θ], 1}, {θ, 5.8629, 2 Pi}, PlotStyle -> Red],
   ParametricPlot[
     mat2.{Sin[θ], Cos[θ], 1}, {θ, 3.1275, 6.1325}],
   Graphics[
     {Line[{mat1.{Sin[θ1], Cos[θ1], 1}, mat2.{Sin[θ2], Cos[θ2], 1}}]}]}, 
  PlotRange -> All];

Now we turn the graphics into a region:

dg = DelaunayMesh@MeshCoordinates@DiscretizeGraphics@gr;

And we can now determine that {0,3} is inside this region:

RegionMember[dg, {0., 3.}]
True

Note that you can get better performance by creating a RegionMemberFunction and applying it directly to a list of points (it's Listable).

rf = RegionMember[dg]; (* create RegionMemberFunction *)
rf[{{0., 3.}, {0., 2.}, {5., 0.}, {0., 8.}, {1., 1.}}] (* apply the function *)

{True, True, False, False, True}

$\endgroup$
4
  • $\begingroup$ Apart from DelaunayMesh[] and RegionMember[](I think DelaunayMesh[] is time-consuming ). I would like to know is there other simple method to do this problem? $\endgroup$
    – xyz
    Commented Mar 26, 2016 at 6:35
  • $\begingroup$ @ShutaoTANG, you can also use ConvexHullMesh in place of DelaunayMesh. $\endgroup$
    – RunnyKine
    Commented Mar 26, 2016 at 6:50
  • 3
    $\begingroup$ @ShutaoTANG Another approach is to use SignedRegionDistance in place of RegionMember and if the result is negative it means the point is inside the region and outside otherwise. $\endgroup$
    – RunnyKine
    Commented Mar 26, 2016 at 6:51
  • $\begingroup$ OK, thanks a lot:) $\endgroup$
    – xyz
    Commented Mar 26, 2016 at 6:58
10
$\begingroup$

I am going to use Graphics`PolygonUtils`PointWindingNumber from R.M's answer to How to check if a 2D point is in a polygon?. In M10 you can use RegionMember.

The idea is to convert your region into a polygon and then test if the point is inside or not.

mat1 = {{0., -5., 0}, {-5.2203, 0., 1.7945}}; 
mat2 = {{-0.8583, -4.9384, 0.1765}, {-5.4189, 0.7822, 2.3088}};

q1 = 2.4798; q2 = 3.1275;
dq = 0.1; (*use smaller value for better precession*)
seg1 = Table[mat1.{Sin[q], Cos[q], 1}, {q, 0, 2.4798, dq}];
seg2 = Table[mat1.{Sin[q], Cos[q], 1}, {q, 5.8629, 2 Pi, dq}];
seg3 = Table[mat2.{Sin[q], Cos[q], 1}, {q, 3.1275, 6.1325, dq}];
seg4 = {mat1.{Sin[q1], Cos[q1], 1}, mat2.{Sin[q2], Cos[q2], 1}};
path = Join[seg1, seg2, seg3, seg4];

(*Make a continuous path from all the points*)
spath = FindCurvePath[path]//First; 
boundary = path[[#]] & /@ spath;

inPolyQ[poly_, pt_] := Graphics`PolygonUtils`PointWindingNumber[poly, pt] =!= 0


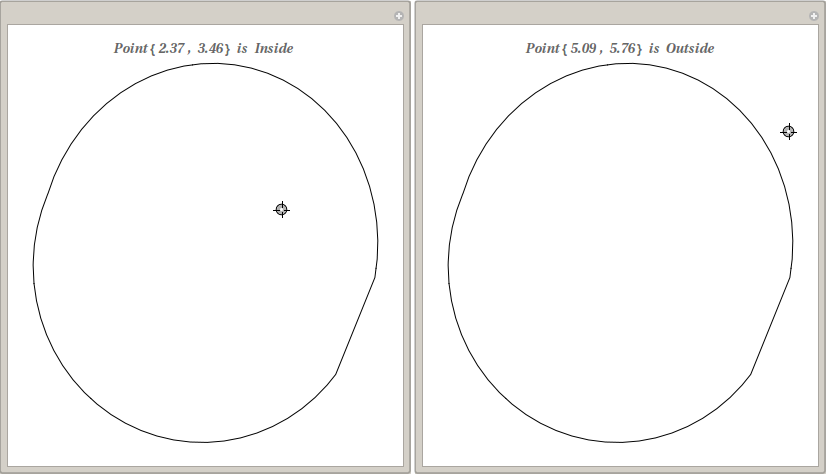
Manipulate[Graphics[Line[boundary], 
 PlotLabel -> Text[Style[StringForm["Point`` is ``", p, 
  If[inPolyQ[boundary, p], "Inside ", "Outside"]], Bold, Italic]]],
 {{p, {0, 0}}, Locator}]

enter image description here

For Mathematica9

For MMA9 you have to use Graphics`Mesh`PointWindingNumber[poly, pt] in place of Graphics`PolygonUtils`PointWindingNumber[poly, pt].

$\endgroup$
2
  • $\begingroup$ Thanks @MarcoB for the edit. You left a � after the final bracket. So I am taking the advantage ;) $\endgroup$
    – Sumit
    Commented Mar 26, 2016 at 12:43
  • $\begingroup$ sorry about that! That's what I get for doing edits on my silly tablet! :-) I've got to look into this PointWindingNumber thing. It sounds very cool! Thanks for digging it out. $\endgroup$
    – MarcoB
    Commented Mar 26, 2016 at 12:54
4
$\begingroup$

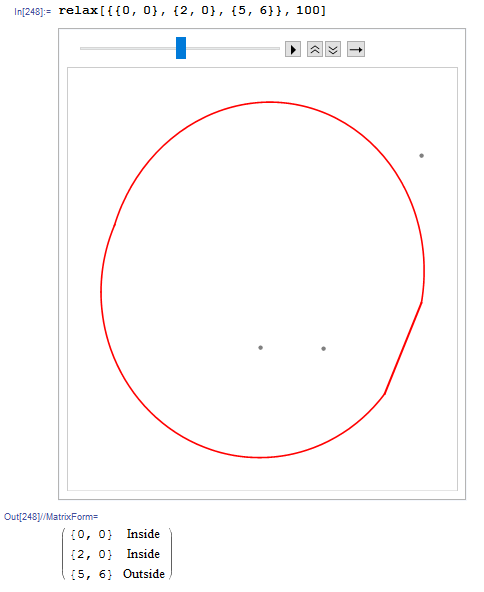
Perhaps a bit of an overkill. Imagine the points on the boundary and the points you input as electric charges:

mat1 = {{0., -5., 0}, {-5.2203, 0., 1.7945}}; 
mat2 = {{-0.8583, -4.9384, 0.1765}, {-5.4189, 0.7822, 2.3088}};
θ1 = 2.4798;
θ2 = 3.1275;
g=Show[
  {ParametricPlot[
     mat1.{Sin[θ], Cos[θ], 1}, {θ, 0, 2.4798}, PlotStyle -> Red], 
   ParametricPlot[
     mat1.{Sin[θ], Cos[θ], 1}, {θ, 5.8629, 2 Pi}, PlotStyle -> Red],
   ParametricPlot[
     mat2.{Sin[θ], Cos[θ], 1}, {θ, 3.1275, 6.1325}, PlotStyle -> Red],
   Graphics[
     {Thick, Red, Line[{mat1.{Sin[θ1], Cos[θ1], 1}, mat2.{Sin[θ2], Cos[θ2], 1}}]}]}, 
  PlotRange -> All];

step[form_] := 
 Function[# - 
    10^-4 Sum[
      Normalize[ext[[i]] - #]/Norm[ext[[i]] - #]^2, {i, 
       Length@ext}]] /@ form
relax[object_, t_] := First@{
   ext = RandomPoint[DiscretizeGraphics@g, 10^3];
   fin = NestList[step, object, t]; 
   Print@ListAnimate[
     Function@Show[g, #, Axes -> False] /@ 
      Function@ListPlot[#, PlotStyle -> Gray] /@ fin];
   Table[{Part[First@fin, i], 
      If[EuclideanDistance[Part[Last@fin, i], Mean@ext] - 
         EuclideanDistance[Part[First@fin, i], Mean@ext] < 0, 
       Text["Inside"], Text["Outside"]]}, {i, Length@First@fin}
     ] // MatrixForm
   }

Usage

Note that increasing t yields more accurate results.

relax[{{0, 0}, {2, 0}, {5, 6}}, 100]

enter image description here

$\endgroup$
4
$\begingroup$

the direct approach:

mat1 = {{0., -5., 0}, {-5.2203, 0., 1.7945}};
mat2 = {{-0.8583, -4.9384, 0.1765}, {-5.4189, 0.7822, 2.3088}};
\[Theta]1 = 2.4798;
\[Theta]2 = 3.1275;
f[1, t_] := mat1.{Sin[t], Cos[t], 1};
f[2, t_] := mat1.{Sin[t], Cos[t], 1};
f[3, t_] := mat2.{Sin[t], Cos[t], 1};
f[4, t_] := 
            t mat1.{Sin[\[Theta]1], Cos[\[Theta]1], 1} +  
      (1 - t) mat2.{Sin[\[Theta]2], Cos[\[Theta]2], 1};
f[1, "range"] = Sequence @@ {0, \[Theta]1};
f[2, "range"] = Sequence @@ {5.8629, 2 Pi};
f[3, "range"] = Sequence @@ {\[Theta]2, 6.1325};
f[4, "range"] = Sequence @@ {0, 1};

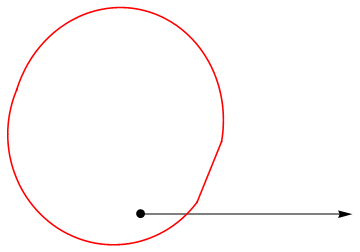
p = RandomReal[{-5, 5}, {2}]
Show[{Graphics@{PointSize[.025], Point[p], Arrow[{p, p + {10, 0}}]},
  Table[ParametricPlot[f[k, t], Evaluate@{t, f[k, "range"]}, 
    PlotStyle -> Red], {k, 4}]}, PlotRange -> All]

enter image description here

count the crossings, if odd we are inside.

OddQ@Total@Table[ Length[t /. Quiet@NSolve[f[k, t][[2]] == #[[2]] && 
          Less @@ Riffle[{f[k, "range"]}, t] && 
          f[k, t][[1]] > #[[1]] , t]] , {k, 4}] &@p

True

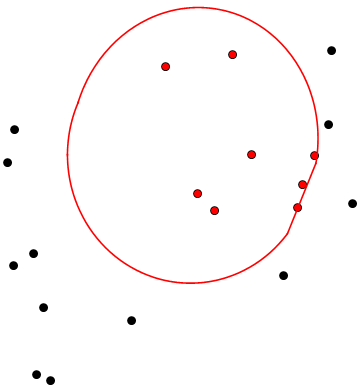
process a bunch of points:

p = RandomReal[{-8, 8}, {20, 2}];
pin = Select[p, 
   OddQ@Total@Table[ Length[t /. Quiet@NSolve[f[k, t][[2]] == #[[2]] && 
            Less @@ Riffle[{f[k, "range"]}, t] && 
            f[k, t][[1]] > #[[1]] , t]] , {k, 4}] &];
Show[{Graphics@{PointSize[.025], Point[p], Red, PointSize[.02], 
    Point[pin]},
  Table[ParametricPlot[f[k, t], Evaluate@{t, f[k, "range"]}, 
    PlotStyle -> Red], {k, 4}]}, PlotRange -> All]

enter image description here

If you have functions that NSolve can't handle you can use other methods such as FindRoot, but you need a scheme to find all the roots, and then you might loose the performance advantage over other methods.

Also to make this robust you need to deal with cases where your projected line exactly hits a junction between piecewise curves. (do a Union on the roots for example )

$\endgroup$
1
$\begingroup$
    gra = Show[{ParametricPlot[
         mat1.{Sin[\[Theta]], Cos[\[Theta]], 1}, {\[Theta], 0, 2.4798}, 
         PlotStyle -> Red], 
        ParametricPlot[
         mat1.{Sin[\[Theta]], Cos[\[Theta]], 1}, {\[Theta], 5.8629, 2 Pi},
          PlotStyle -> Red], 
        ParametricPlot[
         mat2.{Sin[\[Theta]], Cos[\[Theta]], 1}, {\[Theta], 3.1275, 
          6.1325}], 
        Graphics[{Line[{mat1.{Sin[\[Theta]1], Cos[\[Theta]1], 1}, 
            mat2.{Sin[\[Theta]2], Cos[\[Theta]2], 1}}]}]}, 
       PlotRange -> All];
    RegionMember[
 ConvexHullMesh@MeshCoordinates@DiscretizeGraphics@gra, {0, 3}]

True

$\endgroup$
2
  • $\begingroup$ Obviously, {0,3} is inside the boundary. Why your answer is False?:) $\endgroup$
    – xyz
    Commented Mar 26, 2016 at 6:14
  • $\begingroup$ @ShutaoTANG Well just misunderstand your English.I thought you jedge whether or not in the boundry but inside. $\endgroup$
    – yode
    Commented Mar 26, 2016 at 6:48
1
$\begingroup$

Not sure how you would do that in Mathematica, but the simplest way to check if a point is inside a closed shape, is to draw a line through the point.
Then count intersections with the border of the shape from the point going outwards.
If the number is odd, it's inside.

$\endgroup$
2
  • 1
    $\begingroup$ This is more of a comment than answer. If you would like to expand on it and write an actual answer, feel free! Otherwise, please post this is a comment. $\endgroup$
    – march
    Commented Mar 26, 2016 at 17:34
  • $\begingroup$ Also, quoting from @george2079's comment from 5 hours ago: "Then just count the roots, odd->inside." You might want to turn this into code if you can. $\endgroup$ Commented Mar 26, 2016 at 17:36

Your Answer

By clicking “Post Your Answer”, you agree to our terms of service and acknowledge you have read our privacy policy.

Not the answer you're looking for? Browse other questions tagged or ask your own question.