0
$\begingroup$

How can I get data from For loops to use in ListStreamDensityPlot? I tried AppendTo, but it didn't work. I probably did it wrong.

Clear[a, x, y, z, m, n, o, Bx, By, Bz]
a = 0.1 (*amplitude*)
z = 0  (*ploting on different heights*)
For[i = 1; x = m, i < 6, i++, x = 2 Pi/4*(i - 1);
    For[j = 1; y = n, j < 7, j++, y = -3 + (j - 1);
      {Bx = NIntegrate[a*z*Cos[t]/((t^2 - 2 t x + x^2 + y^2 + z^2)^(3/2) - 
        3 (y Sqrt[t^2 - 2 t x + x^2 + y^2 + z^2]Sin[t]) a), 
        {t, -Infinity, Infinity}, AccuracyGoal -> 20,MaxRecursion -> 15];
       By = NIntegrate[-z/((t^2 - 2 t x + x^2 + y^2 + z^2)^(3/2) - 
        3 (y Sqrt[t^2 - 2 t x + x^2 + y^2 + z^2]Sin[t]) a), 
        {t, -Infinity, Infinity}, AccuracyGoal -> 20, MaxRecursion -> 15];
       Bz = NIntegrate[(y + a*(t*Cos[t] - x*Cos[t] - Sin[t]))/
        ((t^2 - 2 t x + x^2 + y^2 + z^2)^(3/2) - 
        3 (y Sqrt[t^2 - 2 t x + x^2 + y^2 + z^2]Sin[t]) a), 
        {t, -Infinity, Infinity}, AccuracyGoal -> 20, MaxRecursion -> 15]};
   ]
 ]
ListStreamDensityPlot[{x, y}, {Bx, By, Bz}]

I only get

[out]=ListStreamDensityPlot[{2 \[Pi], 2}, {0., 0., 1.00294}]

Thanks in advance.

EDIT: With the help of Verbeia I can now make the plot. I would like to get something like this https://i.sstatic.net/3ixqI.png

My wire is a different one than the above though. Mine is a sinusoid.

Is ListVectorDensityPlot the right plot to get plots like the ones above?

a = 0.1
x = Pi/2

data = Table[With[{y = -1 + 0.1 (i - 1), 
   z = -1 + 0.1 (j - 1)}, {{NIntegrate[ a*z*Cos[t]/((t^2 - 2 t x + x^2 + 
    y^2 + z^2)^(3/2) - 3 (y Sqrt[t^2 - 2 t x + x^2 + y^2 + z^2] Sin[t]) a), 
    {t, -Infinity, Infinity}, AccuracyGoal -> 20,  MaxRecursion -> 20], 
    NIntegrate[-z/((t^2 - 2 t x + x^2 + y^2 + z^2)^(3/2) - 
     3 (y Sqrt[t^2 - 2 t x + x^2 + y^2 + z^2] Sin[t]) a), 
     {t, -Infinity,Infinity}, AccuracyGoal -> 20, MaxRecursion -> 20]}, 
    NIntegrate[(y +  a*(t*Cos[t] - x*Cos[t] - Sin[t]))/((t^2 - 2 t x + x^2 + y^2 + 
       z^2)^(3/2) - 3 (y Sqrt[t^2 - 2 t x + x^2 + y^2 + z^2] Sin[t]) a), 
 {t, -Infinity, Infinity}, AccuracyGoal -> 20, MaxRecursion -> 20]}], 
 {i, 1, 21}, {j, 1, 21}]

ListVectorDensityPlot[data, DataRange -> {{-1, 1}, {-1, 1}}]

I get this graph. https://i.sstatic.net/YvqyD.jpg

The field should be rotational.

Is the problem that integrals don't converge? How can I improve the convergence of integrals then? I doubt upping max recursions to 80 would be smart because it would increase the process time a lot. It takes a couple of minutes anyway.

$\endgroup$
2
  • 4
    $\begingroup$ You've seen Table[]? $\endgroup$ Commented Sep 23, 2012 at 23:51
  • 1
    $\begingroup$ Also, your integrals have some convergence problems $\endgroup$ Commented Sep 23, 2012 at 23:53

1 Answer 1

7
$\begingroup$

There are a number of issues with your code. For does not create any output except as side effects. You are saving the results in auxiliary variables (Bx, By and Bz), but at each stage of the loop you are simply redefining those variables as a single number. Of course this is not going to work properly when passed to your ListStreamDensityPlot function call - it's just the last three numbers you calculated. And the actual call you used, with separate {x, y} and {Bx, By, Bz} is not the right syntax: it should be a matrix.

Let's clean up your code by using Table, as J.M. suggested in comments, instead of that For loop. Note how I'm also using With to set x and y locally for each value of the iterates i and j. I've also set up the values in each position in the matrix to be in the form $\{\{x_{ij},y_{ij}\},z_{ij}\}$, which is what ListStreamDensityPlot expects.

fixedupdata = 
 Table[With[{x = 2 Pi/4*(i - 1), 
    y = -3 + (j - 1)}, {{NIntegrate[
      a*z*Cos[t]/((t^2 - 2 t x + x^2 + y^2 + z^2)^(3/2) - 
          3 (y Sqrt[t^2 - 2 t x + x^2 + y^2 + z^2] Sin[
              t]) a), {t, -Infinity, Infinity}, AccuracyGoal -> 20, 
      MaxRecursion -> 15], 
     NIntegrate[-z/((t^2 - 2 t x + x^2 + y^2 + z^2)^(3/2) - 
         3 (y Sqrt[t^2 - 2 t x + x^2 + y^2 + z^2] Sin[
             t]) a), {t, -Infinity, Infinity}, AccuracyGoal -> 20, 
      MaxRecursion -> 15]}, 
    NIntegrate[(y + 
        a*(t*Cos[t] - x*Cos[t] - Sin[t]))/((t^2 - 2 t x + x^2 + y^2 + 
           z^2)^(3/2) - 
        3 (y Sqrt[t^2 - 2 t x + x^2 + y^2 + z^2] Sin[
            t]) a), {t, -Infinity, Infinity}, AccuracyGoal -> 20, 
     MaxRecursion -> 15]}], {i, 1, 5}, {j, 1, 6}]

Leaving aside the issues with convergence of your integrations, which was already mentioned in comments, we get the following output from the above:

{{{{0., 0.}, -0.667667}, {{0., 0.}, -1.00294}, {{0., 
    0.}, -2.01285}, {{0., 0.}, -4.17816*10^-11}, {{0., 0.}, 
   2.01285}, {{0., 0.}, 
   1.00294}}, {{{0., 0.}, -0.665012}, {{0., 0.}, -0.989665}, {{0., 
    0.}, -1.91364}, {{0., 0.}, -6.7949*10^11}, {{0., 0.}, 
   2.18014}, {{0., 0.}, 
   1.01866}}, {{{0., 0.}, -0.667667}, {{0., 0.}, -1.00294}, {{0., 
    0.}, -2.01285}, {{0., 0.}, -4.278*10^-6}, {{0., 0.}, 
   2.01285}, {{0., 0.}, 
   1.00294}}, {{{0., 0.}, -0.670495}, {{0., 0.}, -1.01866}, {{0., 
    0.}, -2.18014}, {{0., 0.}, 5.57178*10^9}, {{0., 0.}, 
   1.91364}, {{0., 0.}, 
   0.989665}}, {{{0., 0.}, -0.667667}, {{0., 0.}, -1.00294}, {{0., 
    0.}, -2.01285}, {{0., 0.}, 0.00047727}, {{0., 0.}, 
   2.01285}, {{0., 0.}, 1.00294}}}

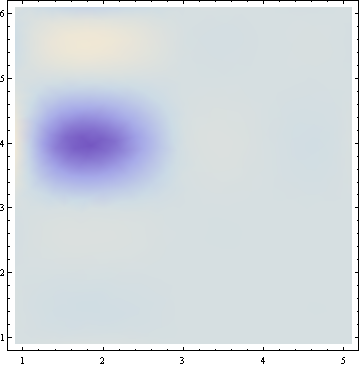
This then produces a graphic, but not any little streamlines.

ListStreamDensityPlot[fixedupdata]

enter image description here

EDIT
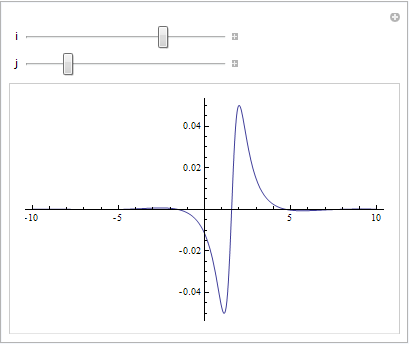
As for why you are having problems with your integration and not getting the vectors you expect, it helps to plot the integrand to see what is going on. Here's what I did.

Manipulate[
 With[{y = -1 + 0.1 (i - 1), z = -1 + 0.1 (j - 1)}, 
  Plot[a*z*Cos[
      t]/((t^2 - 2 t x + x^2 + y^2 + z^2)^(3/2) - 
       3 (y Sqrt[t^2 - 2 t x + x^2 + y^2 + z^2] Sin[t]) a), {t, -10, 
    10}, PlotRange -> All]], {i, 1, 21, 1}, {j, 1, 21, 1}] 

All of the settings for i and j looked something like this:

enter image description here

So the first column of your data is always going to be oscillatory and integrate to something very close to zero. I suspect the issue is that your integrands aren't what you think they are and that there is some small typo/bracketing issue with the function used in the first integration in the triplet.

$\endgroup$
7
  • $\begingroup$ By the way, @bijeli_vitez, welcome to Mathematica.SE! Please consider registering your account so that any upvotes you get on this question are added to those you might get on future questions and answers. That way, over time you will be able to do more on the site (post graphics, edit things, etc). $\endgroup$
    – Verbeia
    Commented Sep 24, 2012 at 4:15
  • $\begingroup$ If you change z, you may get some vectors in the plot (but the integrals still have many problems) $\endgroup$ Commented Sep 24, 2012 at 7:33
  • $\begingroup$ Thanks for the help. I have edited my original post. Can you please look at it again? $\endgroup$
    – malganis
    Commented Sep 24, 2012 at 21:51
  • 1
    $\begingroup$ Glad to help, but "Why don't the integrals converge?" is a completely different question. $\endgroup$
    – Verbeia
    Commented Sep 24, 2012 at 22:31
  • $\begingroup$ I will post another question about that then. $\endgroup$
    – malganis
    Commented Sep 24, 2012 at 22:44

Your Answer

By clicking “Post Your Answer”, you agree to our terms of service and acknowledge you have read our privacy policy.

Not the answer you're looking for? Browse other questions tagged or ask your own question.