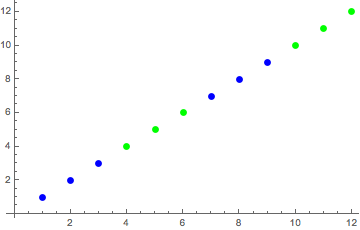
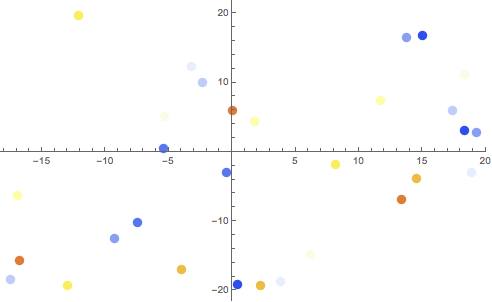
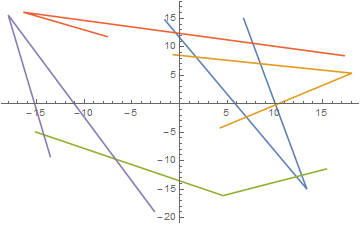
Let's say I have a complex valued matrix $\begin{pmatrix}1+I&2+2I&3+3I\\4+4I&5+5I&6+6I\end{pmatrix}$ represented by a list:
list = {{1 + I, 2 + 2 I, 3 + 3 I}, {4 + 4 I, 5 + 5 I, 6 + 6 I}}
I know how to plot each point of the matrix on the complex plane:
Mlist = Table[Table[{Re[list[[i,j]]], Im[list[[i,j]]]}, {i,1,2}], {j,1,3}];

ListPlot[Mlist, PlotRange -> All]
In my case, I have 1000 rows, and I would like 2 things:
Each point on a given row has the same color
The color of each row vary regularly along the number of row.
I have no idea how to handle this. Any suggestion?


Tableexpressions can be achieved byTranspose@ReIm[list]. $\endgroup$