1
$\begingroup$

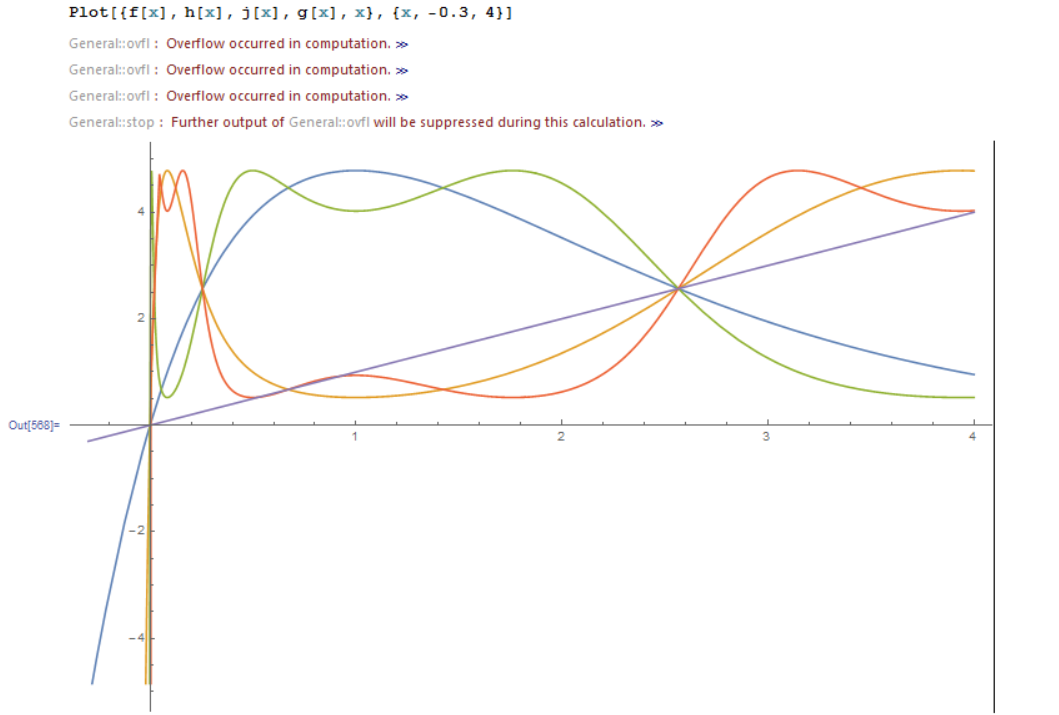
I want to plot the iterates of the function $f(x)=13xe^{-x}$ up to power $4$. So I am using the code Plot[{f[x], h[x], j[x], g[x], x}, {x, -0.3, 4}] where $f,h,j,g$ are the first, second, third, and fourth iterate of the function respectively. This sort of works, but overflow errors are thrown in my face:

enter image description here

This is probably because the iterates get pretty complicated and probably give very large values. So, is there a better way to plot these functions?

$\endgroup$
2
  • $\begingroup$ By iterates, do you mean h[x] == f[f[x]] etc.? What is the code you use to define f,h,j,g? $\endgroup$ Commented Mar 9, 2016 at 7:47
  • $\begingroup$ The trouble's coming from the left. Try Plot[Rest[NestList[13 # Exp[-#] &, x, 4]], {x, -0.03, 4}, Evaluated -> True] instead. $\endgroup$ Commented Mar 9, 2016 at 7:48

1 Answer 1

2
$\begingroup$

As pointed out by J.M., the problem is with the negative x range. Particularly with your g[x]=f[f[f[f[x]]]], which evaluates to

28561 E^(-x - 13 E^-x x - 169 E^(-x - 13 E^-x x) x - 
  2197 E^(-x - 13 E^-x x - 169 E^(-x - 13 E^-x x) x) x) x

This very quickly approaches the $MaxNumber for negative values,

$MaxNumber
f[f[f[f[-.06591]]]]
(* 1.605216761933662*10^1355718576299609 *)
(* -5.992559179678360*10^1344011404161905 *)

So you can either truncate the negative plotting range, or just use Quiet to suppress the error,

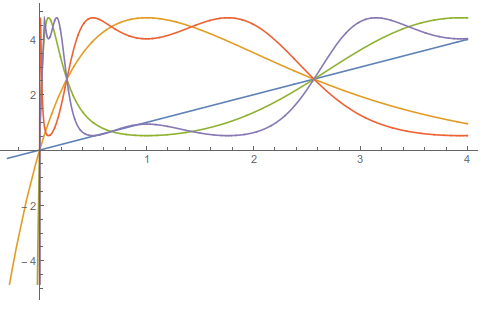
Plot[{f[x], f[f[x]], f[f[f[x]]], f[f[f[f[x]]]], x}, {x, -0.3, 4}, 
  Evaluated -> True] // Quiet

enter image description here

$\endgroup$

Your Answer

By clicking “Post Your Answer”, you agree to our terms of service and acknowledge you have read our privacy policy.

Not the answer you're looking for? Browse other questions tagged or ask your own question.