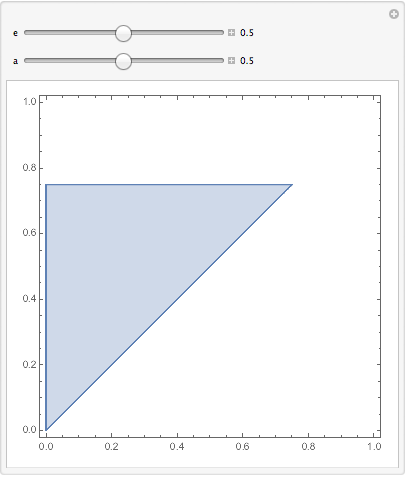
I'd like to graph the following inequality on the x-y plane:
$$ P(y): (\forall x\in [0,y))\left(\frac{x - \epsilon(1+a)}{a} \leq y \leq \frac{x + \epsilon(1+a)}{a}\right) $$
This is the set of points $(x,y)$ where $\frac{x - \epsilon(1+a)}{a} \leq y \leq \frac{x + \epsilon(1+a)}{a}$ for all $0 \leq x < y$. That is, for a point to be in the set, it must satisfy the inequality, and all points to its "left" with the same y-value must also satisfy the inequality.
$\epsilon \in (0,1]$ and $a \in (0,1]$ are both pre-defined constants.
Ideally, the plot would use multiples or combinations of $a$ or $\epsilon$ rather than numerical axis labels, but if I have to plug in values for $a$ and $\epsilon$ to plot this in Mathematica that would be okay (as an aside, if anyone knows an application that can plot this purely symbolically, please let me know!).

