Here is some sample data
m = {{0.658254, 1.04273, 0.15, 0.613587, 2}, {0.157981, 4.03653, 1.25,
        0.437706, 1}, {0.149204, 1.65371, 2.72, 0.571777, 1}, {0.495885,
        3.62412, 1.67, 0.00119993, 3}, {-0.149204, 2.23414, 200., 0.260858,
        0}, {-0.50905, 2.98259, 200., 0.146681, 0}, {-0.662643, 1.60788,
        21.77, 0.0305032, 1}, {0.539769, 0.385922, 0.33, 0.450807,
        2}, {0.157981, 3.77687, 1.04, 0.584416, 1}, {-0.623147, 4.32675,
        200., 0.173352, 0}};
A color code
getColor[m_List, i_Integer] := Module[{s = m[[i, 5]]},
Which[s == -1, White, s == 0, Blue, s == 1, Red, s == 2, Darker[Green],
      s == 3, Cyan]];

data = Table[{PointSize[0.004], getColor[m, i], Point[{m[[i, 1]],
       m[[i, 2]]}]}, {i, 1, Length[m]}];
And finally we plot them
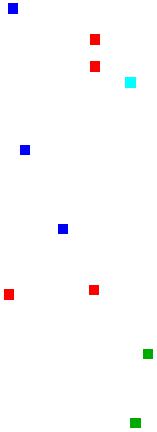
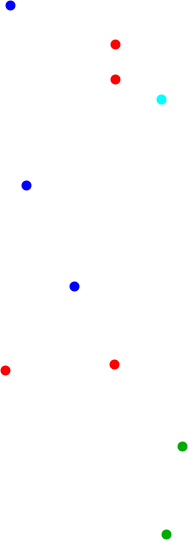
S0 = Graphics[data]
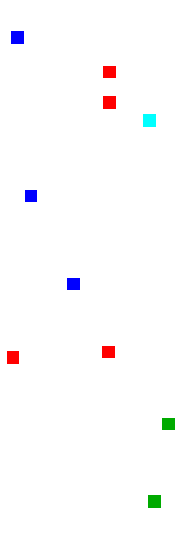
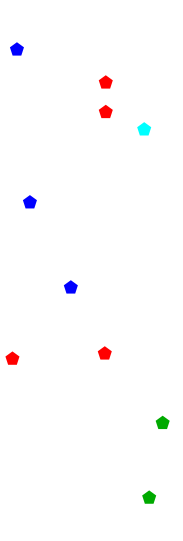
Graphics renders the data using dots with the predefined point size. How can I change the plot markers to small squares instead of dots? Of course, I should be able to control the size of the new plot markers.
EDIT
If I use @Andrew S method in a Show like
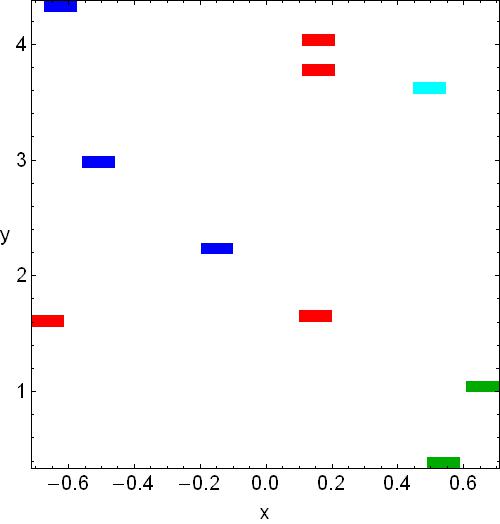
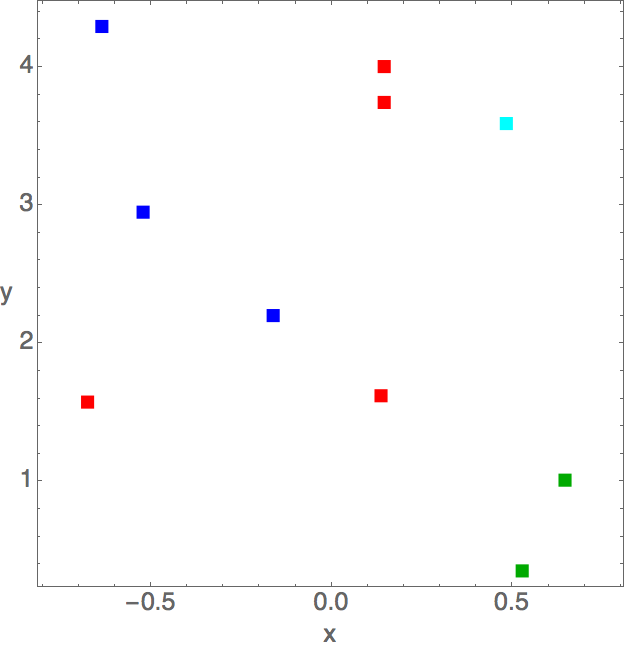
P0 = Show[S0, Axes -> False, Frame -> True, FrameLabel -> {"x", "y"},
     RotateLabel -> False, LabelStyle -> Directive[FontFamily -> "Helvetica", 20],
     PlotRange -> All, AspectRatio -> 1, PlotRangeClipping -> True,
     PlotRangePadding -> 0, ImageSize -> 500]
then the squares become rectangles.
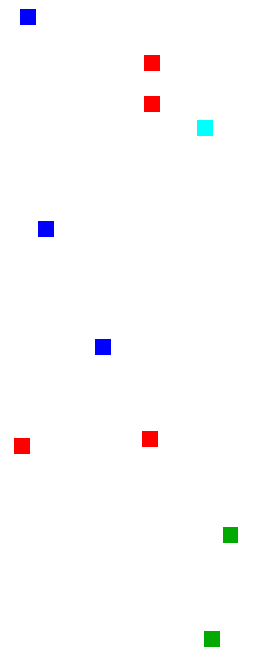
The output of the Graphics
And then the output of the Show
EDIT 2
@m_goldberg:
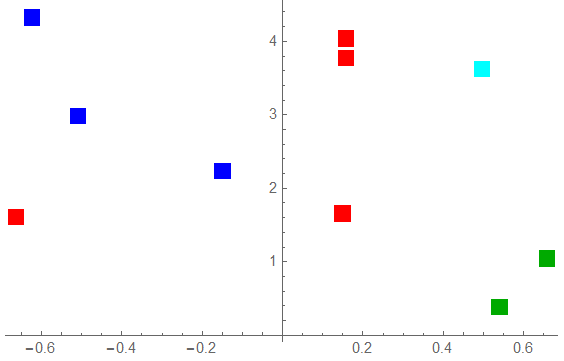
The final plot markers are much bigger than in Graphics, while some of them are cut in half at the borders.

Graphicsyourself and you're not usingListPlot. It is a very small step to useRectangleinstead ofPointand I wonder why you haven't just tried that? $\endgroup$AspectRatiothing. If you want to go this way, then you have to specify the correct ratio here for the markers. See my edit. $\endgroup$