9
$\begingroup$

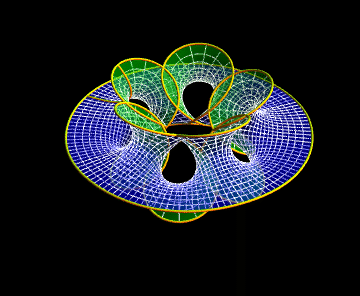
I'm plotting Richmond's minimal surface, and I get this annoying boundary 'seam' in the central disk at the 10 o'clock position. Any ideas about how to get rid of it?

enter image description here

Thanks in advance!

Code used:

Richmond[n_, z_] := {
  -1/(2 z) - z^(2 n + 1)/(4 n + 2), 
  -I/(2 z) + I z^(2 n + 1)/(4 n + 2), 
  z^n/n
};

richmond =  ParametricPlot3D[
  Re[Richmond[5, r Exp[I theta]]], {r, 0.5, 1.16}, {theta, 0, 2 Pi},
  Boxed -> False, Axes -> False, 
  Background -> Black, Mesh -> {16, 128}, 
  MeshStyle -> {{Thick, White}, {Thick, White}}, 
  PlotStyle -> {Opacity[0.5], FaceForm[Green, Blue]}, 
  BoundaryStyle -> {Tube[.01], Yellow}, PlotPoints -> {100, 100}
]
$\endgroup$
0

1 Answer 1

10
$\begingroup$

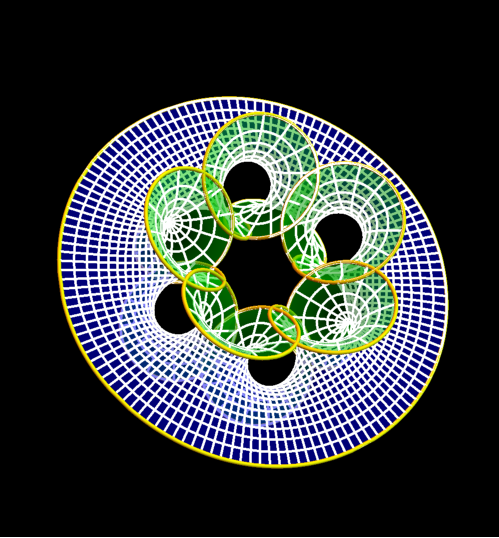
That's a boundary, unfortunately BoundaryStyle does not allow to set it for each parameter separately.

You can leave automatic styling of the boundary in the main plot (so we won't have a gap in place of this yellow line) and add fancy boundary, only for r, in separate plot:

Show[
 ParametricPlot3D[
  Re[Richmond[5, r Exp[I theta]]], {r, 0.5, 1.16}, {theta, 0, 2 Pi},
  Boxed -> False, Axes -> False, Background -> Black, Mesh -> {16, 128}, 
  PlotPoints -> {100, 100}, MeshStyle -> {{Thick, White}, {Thick, White}}, 
  PlotStyle -> {Opacity[0.5], FaceForm[Green, Blue]}, BoundaryStyle -> {Thick, White}]
 ,
 ParametricPlot3D[
   Re[Richmond[5, # Exp[I theta]]] & /@ {.5, 1.16}, {theta, 0, 2 Pi}, 
   PlotStyle -> Directive[Yellow, Tube[.01]]
 ]
]

enter image description here

$\endgroup$
1
  • $\begingroup$ Many, many thanks! Works like a charm. $\endgroup$ Commented Feb 26, 2016 at 22:05

Your Answer

By clicking “Post Your Answer”, you agree to our terms of service and acknowledge you have read our privacy policy.

Not the answer you're looking for? Browse other questions tagged or ask your own question.