I am using the following code in Mathematica 8.0
DensityPlot[Sin[5 x], {x, -10, 10}, {y, -10, 10}, PlotRange -> All]
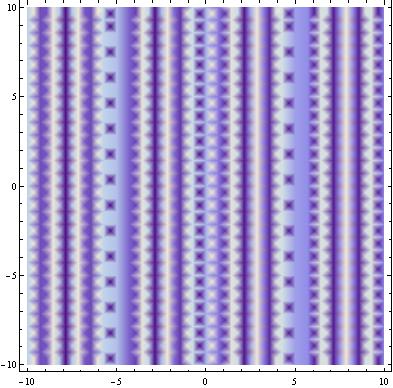
The plot should clearly be independent of y, but the result I am getting is
Is there any way to fix this with this version of Mathematica? Am I doing something wrong?


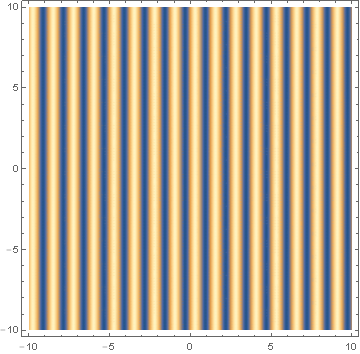
PlotPoints -> 50- the resolution isn't high enough by default. $\endgroup$