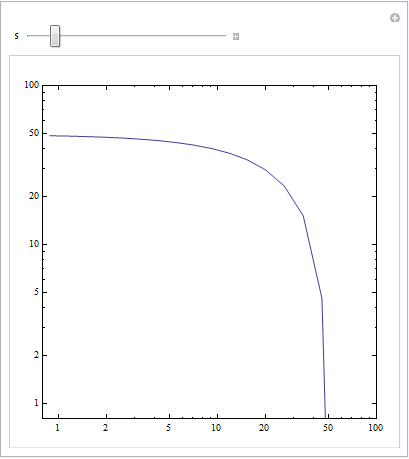
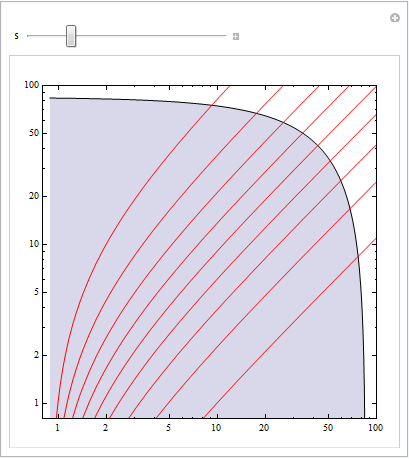
I notice that LogLogPlot runs quite bit more slowly than ordinary Plot. For example, consider the following two blocks of code which plots (using Manipulate) a region in linear scale and log-linear scale. Notice how the log-log-scale manipulation runs more sluggishly. Is there a way to speed up the log-log-scale version?
Linear-scale code:
 Mhad = 0.93827;
 Table[Tooltip[(MxSq - M^2) x/(1 - x) /. M -> Mhad, "x=" <> ToString[x]], {x, 0, .9, .1}];
 Manipulate[Plot[{1/s (s - M^2) (s - MxSq) /. M -> Mhad, %},
   {MxSq, Mhad^2, 100}, PlotRange -> {{0, 100}, {0, 100}},
   AspectRatio -> 1, Filling -> {1 -> Axis}, Frame -> True,
   PlotStyle -> Table[If[i == 1,
     RGBColor[0, 0, 0],
     {RGBColor[1, 0, 0], Thickness[.001]}], {i, 1, 11}]], {{s, 50}, 1,
     400}]
Log-log-scale:
 Table[Tooltip[(MxSq - M^2) x/(1 - x) /. M -> Mhad, "x=" <> ToString[x]], {x, 0, .9, .1}];
 Manipulate[LogLogPlot[{1/s (s - M^2) (s - MxSq) /. M -> Mhad, %},
   {MxSq, Mhad^2, 100}, PlotRange -> {{.8, 100}, {.8, 100}},
   AspectRatio -> 1, Filling -> {1 -> Axis}, Frame -> True,
   PlotStyle -> Table[If[i == 1,
     RGBColor[0, 0, 0],
     {RGBColor[1, 0, 0], Thickness[.001]}], {i, 1, 11}]], {{s, 50}, 1,
     400}]


AbsoluteTiming. But I replaced the%with an explicit label for theTablein the previous line - perhaps that is the issue? $\endgroup$