0
$\begingroup$

I am calculating the phase spectrum of a linear chirped signal. I actually don't know how the phase spectrum should be, but I would expect something in the range of interest (the bandwidth) at least to behave smoothly. This is what I obtain:

(*Define the time range and the number of sample points,this \
determines the frequency range and resolution.In order for the \
fftshift function to work properly,the number of sample points should \
be even.*)
trange = 10.0;
num = 2^12;
dt = trange/num;
df = 1/(num dt);


fftshift[flist_] := RotateRight[flist, (Length@flist)/2 - 1];

signal[t_] := 
 Cos[initialPhase + 
    2*Pi*(chirpInitialFrequency*t + (chirpLinearRate/2)*
        t^2)]*(UnitStep[t] - UnitStep[t - 3.0])
initialPhase = 0.0;
chirpFrequencyCenter = 5.0;
chirpBandwidth = 5.0;
chirpInitialFrequency = chirpFrequencyCenter - chirpBandwidth/2;
chirpFinalFrequency = chirpFrequencyCenter + chirpBandwidth/2;
chirpDuration = 3.0;
chirpLinearRate = (chirpFinalFrequency - chirpInitialFrequency)/
   chirpDuration;

(*Now define the sampled signal in the time domain*)

xValuesSampledSignal := 
  RotateLeft[Table[t, {t, -dt num/2 + dt, num/2 dt, dt}], num/2 - 1];
yValuesSampledSignal = signal /@ xValuesSampledSignal;

(*Then define the spectrum,and plot the signal along with the \
amplitude and phase of the spectrum*)
yValuesDiscreteFourierTransform = 
  fftshift[Fourier[yValuesSampledSignal, 
    FourierParameters -> {1, -1}]];
ListLinePlot[Transpose[{xValuesSampledSignal, yValuesSampledSignal}], 
 PlotRange -> {{-5, 5}, All}, PlotLabel -> "Signal"]
ListLinePlot[Abs[dt yValuesDiscreteFourierTransform], 
 DataRange -> df {-num/2 + 1, num/2}, PlotRange -> {{-25, 25}, All}, 
 PlotLabel -> "Abs spectrum"]
ListLinePlot[Arg[dt yValuesDiscreteFourierTransform], 
 DataRange -> df {-num/2 + 1, num/2}, PlotRange -> {{-25, 25}, All}, 
 PlotLabel -> "Arg spectrum"]

The magnitude spectrum seems correct. I think the routine to calculate the spectrum is correct, it works well with other more simple signals.

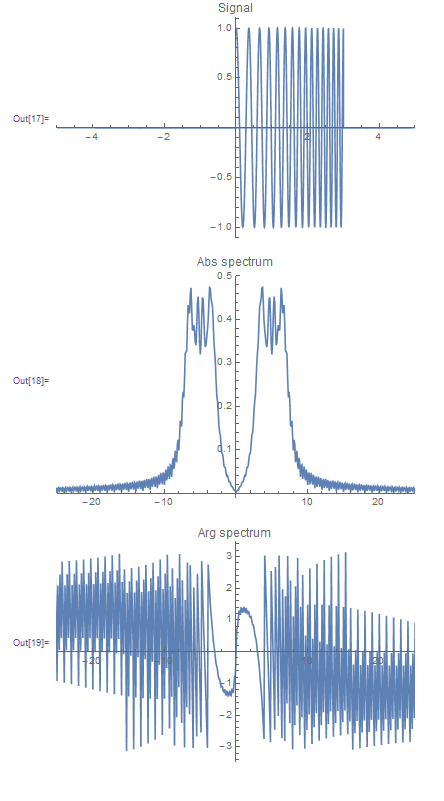
enter image description here

$\endgroup$
1
  • 3
    $\begingroup$ I don't see a question in this post. Exactly what are you asking? $\endgroup$
    – m_goldberg
    Commented Dec 30, 2015 at 5:31

1 Answer 1

4
$\begingroup$

Juan, this is more of a math, or a signal processing question, less of a Mathematica question, so you might have some luck asking over at the signal processing SE. I can make a couple of comments.

Firstly, you can try to separate the effects of a discrete transform from the regular transform. The function you are transforming is not so simple. It is the product of a rectangle function and a linearly chirped cosine, so the transform will be a convolution of the sinc function and whatever the transform of the chirped cosine is. There will necessarily be edge effects in the numeric transform, since the sinc function has lobes out to infinity, which die off pretty slowly. Since the numeric transform won't include these high frequencies that will introduce artifacts.

The phase of the analytic transform would not be very well behaved here either, just compare

aft = FourierTransform[
   Cos[initialPhase + (chirpInitialFrequency*t + (chirpLinearRate/2)*
         t^2)]*(UnitStep[t] - UnitStep[t - 3.0]), t, ω, 
   FourierParameters -> {1, -1}];

{Plot[Re[aft], {ω, -25, 25}],
 Plot[Abs[aft], {ω, -25, 25}],
 Plot[Arg[aft], {ω, -25, 25}]}

enter image description here

To figure out how to get a more faithful DFT, you might ask elsewhere - I am far from an expert on signal processing.

$\endgroup$
1
  • $\begingroup$ Hi, thanks for the answers. Sorry for not posting it in the appropriate place. I am kind of new here. I actually thing the problem is "just" to unwrap the phase. $\endgroup$
    – Gabriel
    Commented Dec 31, 2015 at 2:10

Your Answer

By clicking “Post Your Answer”, you agree to our terms of service and acknowledge you have read our privacy policy.

Not the answer you're looking for? Browse other questions tagged or ask your own question.