1
$\begingroup$

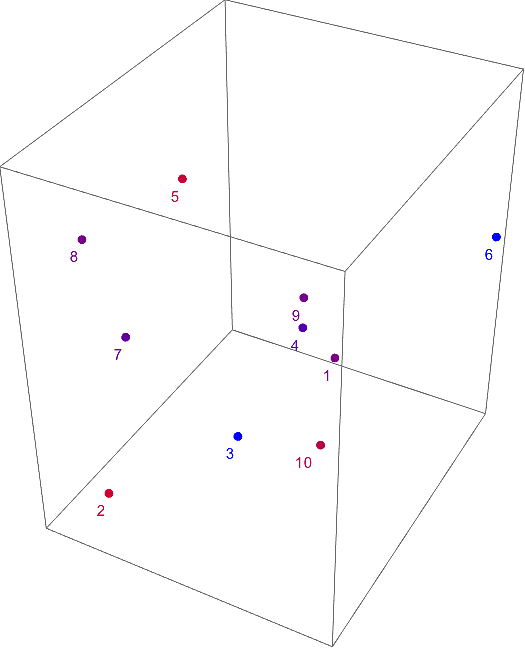
I am doing a Finite Difference Method for 3D heat diffusion, so I need my ListPointPlot3D to be color coded on a range from deep red to deep blue depending on the temperature of the point.

My instinct is that I should have a fourth dimension to my list of points describing the temperature at that point, e.g {1,1,1,40} would describe a temperature of 40 at the first point in my partition, and so on. Is there a plotting option that lets me range the color of a point based on this 4th parameter?

If not, do you see any other way I can do this in Mathematica? I have tried ColorFunction, but I don't want my temperature to depend on the spatial dimensions x,y,z, I want it to depend on a fourth dimension "w" where the temperatures exist.

Many thanks

$\endgroup$
1
  • 1
    $\begingroup$ ColorFunction -> Function[{x,y,z}, Hue[z]] $\endgroup$ Commented Nov 7, 2015 at 1:20

1 Answer 1

3
$\begingroup$
SeedRandom[1];

(data = Append @@@
    ({RandomReal[{0, 1}, {10, 3}], 
       RandomReal[{0, 100}, 10]} //
      Transpose)) // Grid

enter image description here

n = 1;
Graphics3D[{AbsolutePointSize[6],
 {Blend[{Blue, Red}, Rescale[Last[#], {0, 100}]],
 Point[Most[#]], Text[n++, Most[#], {2, 2}]} & /@ data}]

enter image description here

$\endgroup$
2
  • $\begingroup$ I'd probably use MapIndexed[] with Text[] for the labeling myself. $\endgroup$ Commented Nov 7, 2015 at 1:47
  • $\begingroup$ Thanks Bob, couldn't be more to the point! $\endgroup$
    – Mike
    Commented Nov 7, 2015 at 1:53

Your Answer

By clicking “Post Your Answer”, you agree to our terms of service and acknowledge you have read our privacy policy.

Not the answer you're looking for? Browse other questions tagged or ask your own question.