2
$\begingroup$

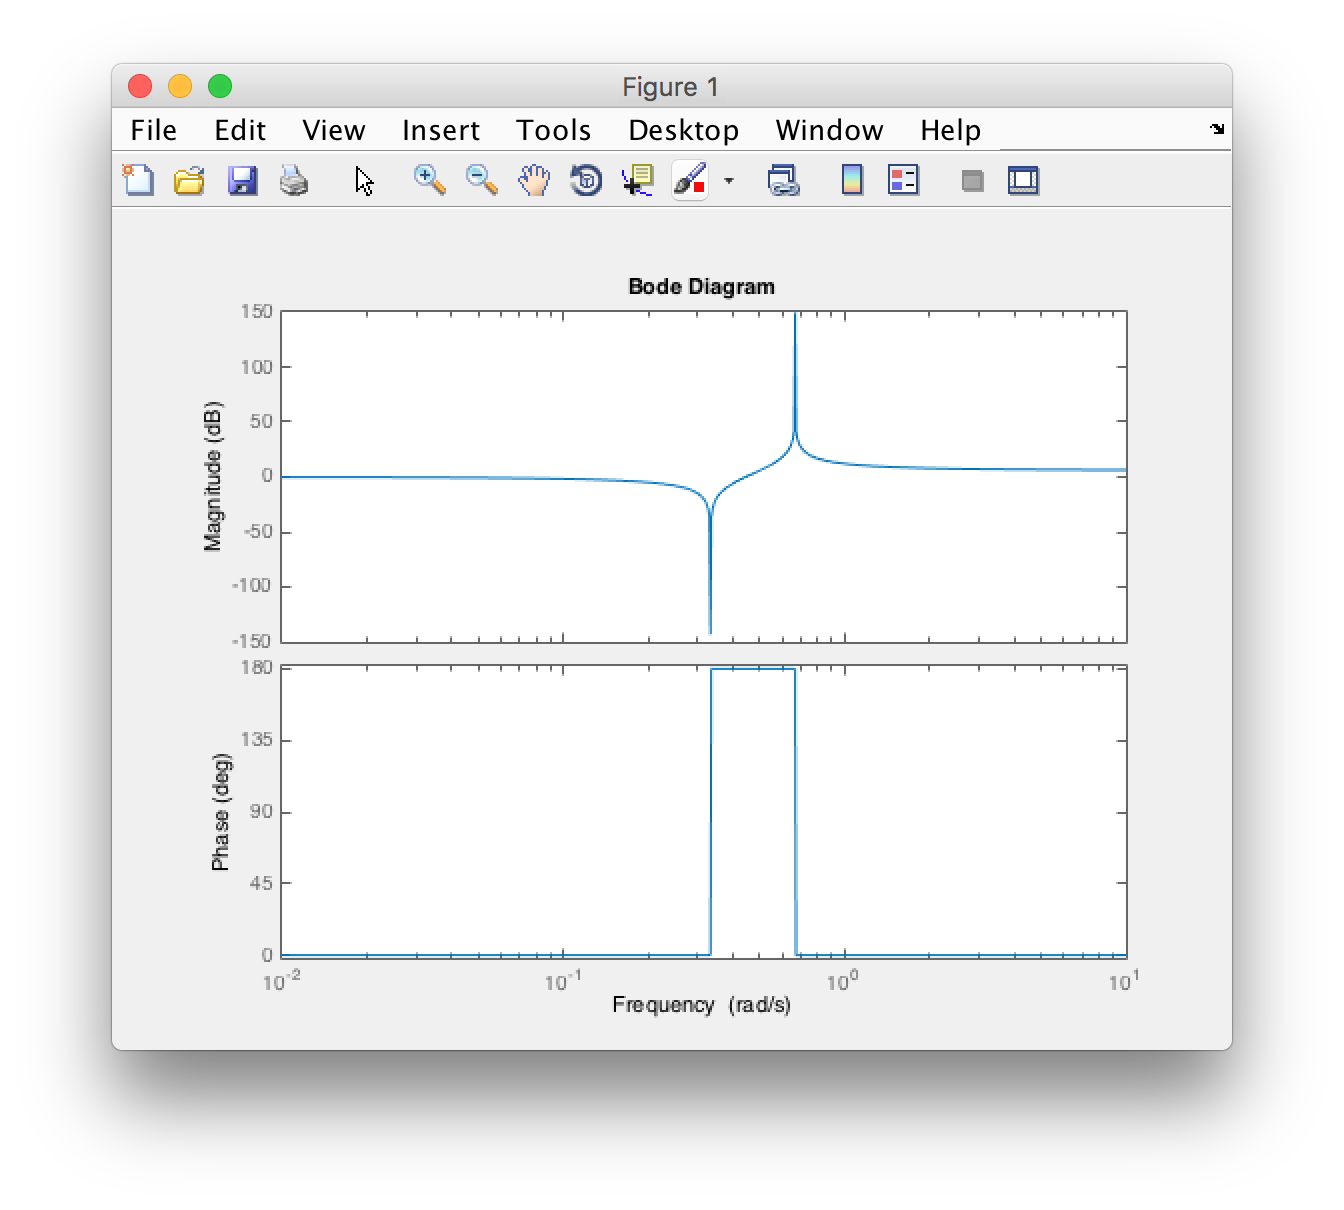
I was doing the TransferFunctionModel and BodePlot. But the result from Mathematica and MATLAB are different.

The function is as follows:

Bi = TransferFunctionModel[(1 + 3*I*ω)/(1 + 1.5*I*ω), ω];

BodePlot[Bi, GridLines -> Automatic, ImageSize -> 400, 
         FrameLabel -> {{{"Magnitude (db)", None}, {None, 
         "Frequency Transfer Function Inside"}}, {{"Phase(deg)", 
          None}, {"Frequency (rad/sec)", None}}}, 
         ScalingFunctions -> {{"Log10", "dB"}, {"Log10", "Degree"}}, 
         PlotRange -> {{{0, 100}, Automatic}, {{0, 100}, {0, 20}}}, 
         PlotStyle -> {Red, Thick}];
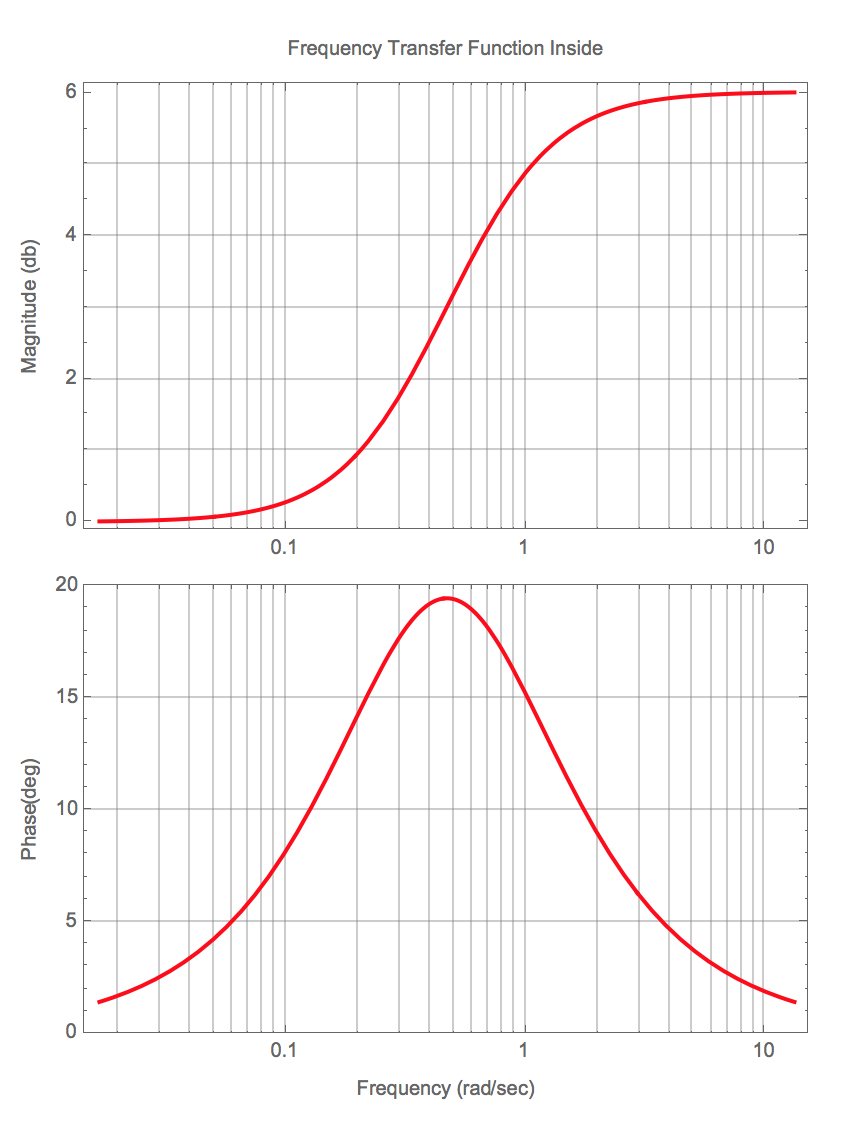
Mathematica result MATLAB result

$\endgroup$
3
  • $\begingroup$ How is the phase treated in each case? Phase can be wrapped between 0 to 2Pi or unwrapped to go to infinity. $\endgroup$
    – Hugh
    Commented Sep 21, 2015 at 18:01
  • $\begingroup$ Actually in both cases I didn't specify the phase range. The phase range in MM has negative part but in Matlab the phase is positive. $\endgroup$
    – yangyang
    Commented Sep 21, 2015 at 19:11
  • $\begingroup$ Without all the options in BodePlot,you'll get the same. $\endgroup$
    – Phab
    Commented Oct 1, 2015 at 11:55

1 Answer 1

5
$\begingroup$

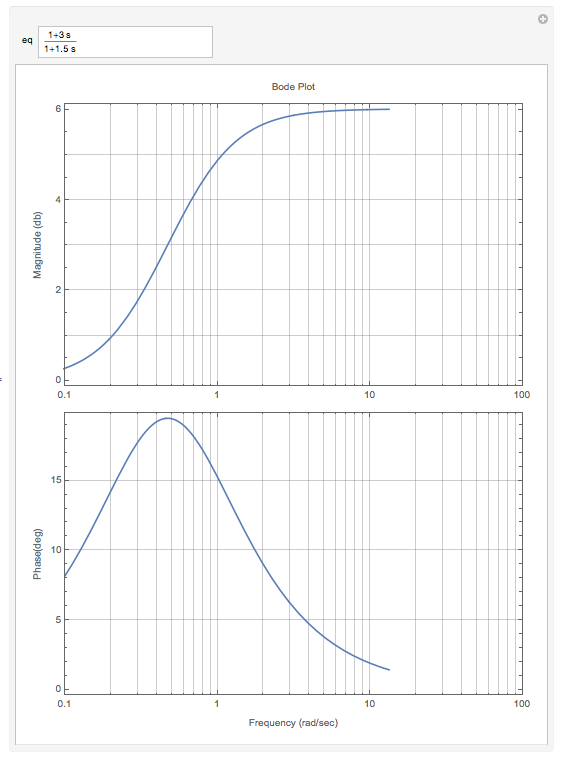
I'm getting a minimum phase of 0 in Mathematica as well.

Manipulate[tf = TransferFunctionModel[eq, s];

 BodePlot[tf, GridLines -> Automatic, ImageSize -> 500, 
  FrameLabel -> {{{"Magnitude (db)", None}, {None, 
      "Bode Plot"}}, {{"Phase(deg)", None}, {"Frequency (rad/sec)", 
      None}}}, 
  ScalingFunctions -> {{"Log10", "dB"}, {"Log10", "Degree"}}, 
  PlotRange -> {{{0.1, 100}, Automatic}, {{0.1, 100}, 
     Automatic}}], {eq, (1 + 3 s)/(1 + 1.5` s)}]

enter image description here

$\endgroup$
8
  • $\begingroup$ But eq should be (1+3*is)/(1+1.5*is). Did you miss the "i"? $\endgroup$
    – yangyang
    Commented Sep 22, 2015 at 6:33
  • 1
    $\begingroup$ @yangyang Your use of "i" is non standard. Usually there are no imaginary units in the Laplace domain and you only get them when you replace s with i w. The Mathematica Bode plot does this for you. It assumes you are putting in an s-plane transfer function and want to plot it on the frequency axis. You need to clarify what you are trying to do. $\endgroup$
    – Hugh
    Commented Sep 22, 2015 at 13:56
  • $\begingroup$ @yangyang As Hugh said, I substituted iw with s so that it would work with a document that I had written earlier that calculates from the Laplace space. As he also pointed out, your mistake was that TransferFunctionModel[] assumes Laplace domain and you didn't make the substitution of wi ->s. Now that I try it again using s*I, I'm getting the -300 you were mentioning earlier. $\endgroup$
    – Brian G
    Commented Sep 22, 2015 at 14:31
  • $\begingroup$ @BrianG I understand your point. Thank you for your help!!! $\endgroup$
    – yangyang
    Commented Sep 22, 2015 at 14:48
  • 1
    $\begingroup$ @BrianG I know what is the problem. If I use b=(1+3*s)/(1+1.5*s); then I got the same as MM. It seems the imaginary part "i" should not be there. $\endgroup$
    – yangyang
    Commented Oct 1, 2015 at 11:28

Your Answer

By clicking “Post Your Answer”, you agree to our terms of service and acknowledge you have read our privacy policy.

Not the answer you're looking for? Browse other questions tagged or ask your own question.