7
$\begingroup$

Is there an easy way to do a log-transformation of an image? I'm not taking about the colours, but the geometry. The difficulty is to extrapolate pixels and round-offs.

For example, an white image with horizontal dots whose $x$-coordinates follow a power law would be transformed to a white image with regularly spaced dots.

$\endgroup$
8
  • $\begingroup$ There was a related question: How does one set a logarithmic scale in a ContourPlot?. I guess this is a duplicate, otherwise you should explain more clearly your expectations. Moreover you should take a closer look at the logarithmic-scale tag. $\endgroup$
    – Artes
    Commented Sep 14, 2015 at 0:49
  • $\begingroup$ The difference is that an imported image is not the same type as a plot: that are pixels instead of numbers. I tried the code to make sure and I get an error ListLogLogPlot called with 0 arguments; 1 argument is expected. $\endgroup$
    – anderstood
    Commented Sep 14, 2015 at 0:55
  • $\begingroup$ I'm afraid that it is very unclear to me what you want to accomplish, especially when you mention "the geometry". Could you be more specific, and possibly provide an example? $\endgroup$
    – MarcoB
    Commented Sep 14, 2015 at 2:07
  • $\begingroup$ @MarcoB I insist on geometry, in contrast to colour, because it is more natural to think of log as an application over the pixels (resulting in a change of contrast). Here, I would like to distort the image in such a way that points near the left end would be moved to the left, and the more a point is initially on the right, the more it is move to the left (log transformation). I understand it might not be very clear. Unfortunately, I don't see how I can give an example as it is exactly what I am trying to do. I'll think about it and try to find a reformulation with illustration if possible. $\endgroup$
    – anderstood
    Commented Sep 14, 2015 at 2:12
  • 1
    $\begingroup$ ImageTransformation and ImageForwardTransformation are probably what you're looking for. $\endgroup$
    – shrx
    Commented Sep 14, 2015 at 8:26

1 Answer 1

7
$\begingroup$

You can achieve the desired transformation with the ImageForwardTransformation function. The transformation effect is easily visible on a grid image:

grid = Rasterize[
  Graphics[Rectangle[], 
   GridLines -> {Range[.05, .95, .05], Range[.05, .95, .05]}, 
   GridLinesStyle -> Directive[{White, Thick}], 
   Method -> {"GridLinesInFront" -> True}, PlotRangePadding -> 0, 
   ImageSize -> 300]]
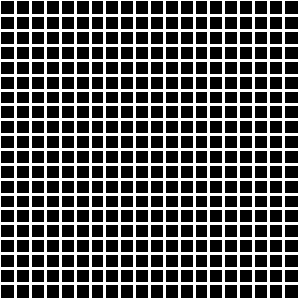
linear grid

You can do the transformation on both dimensions

ImageResize[
 ImageForwardTransformation[grid, Log[# + 0.1] &, PlotRange -> All], 
 ImageDimensions[grid]]
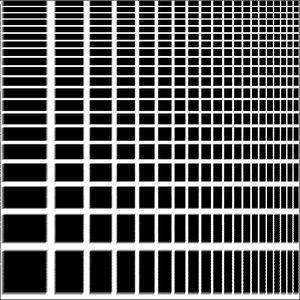
log grid both axes

or just on one (x in this example):

ImageResize[
 ImageForwardTransformation[grid, {Log[#[[1]] + 0.1], #[[2]]} &, 
  PlotRange -> All], ImageDimensions[grid]]
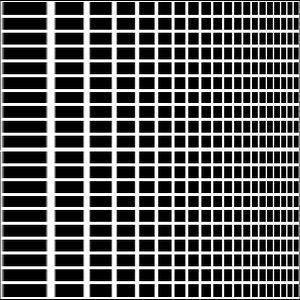
log grid x coordinate

Unfortunately, you can't explicitly set the Method used in the interpolation of the transformed image by choosing an option from the Resampling documentation. You can only switch between the Automatic method or None.

$\endgroup$
1
  • 1
    $\begingroup$ When you know the inverse function, it's better to use ImageTransformation since then you benefit from good interpolation, etc. Like that: ImageTransformation[grid, InverseFunction[Log[# + 0.1] &], ImageDimensions[grid], PlotRange -> All] $\endgroup$ Commented Sep 23, 2015 at 0:52

Your Answer

By clicking “Post Your Answer”, you agree to our terms of service and acknowledge you have read our privacy policy.

Not the answer you're looking for? Browse other questions tagged or ask your own question.