4
$\begingroup$

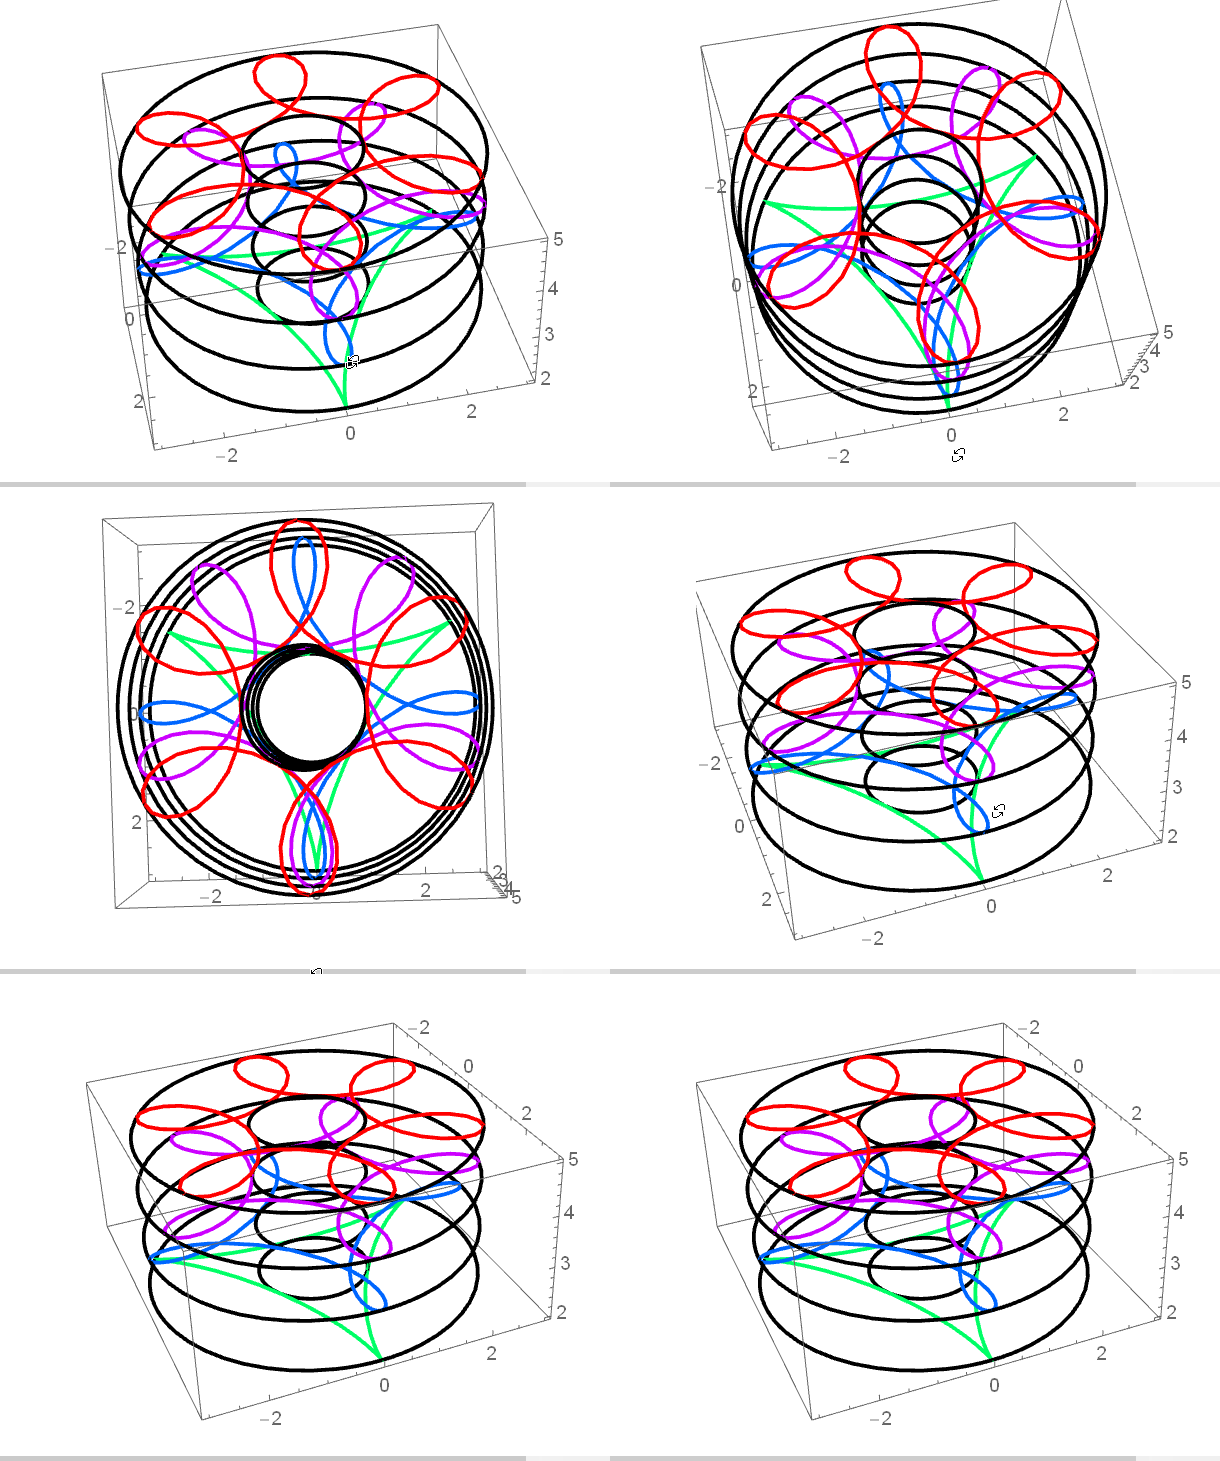
Suppose you have a series of 2D graphics that depend on a parameter. For example,

g[z_] := ParametricPlot[{2 Cos[t] + Cos[z t], 2 Sin[t] - Sin[z t]}, {t, 0, 2 Pi}, 
   PlotStyle -> {Thick, Hue[z/5]}, 
   Epilog -> {Circle[], Circle[{0, 0}, 3], Hue[z/5], Text[Style[z, Bold, 16]]}];

Table[g@z, {z, 2, 5}]

stack1

How can one stack these graphics into a single 3D graphic, using the parameter as the z-axis?

$\endgroup$
1

2 Answers 2

7
$\begingroup$

One way to do this is to covert the 2D graphics primitives to an equivalent 3D primitive using a set of rules.

It's not so simple as tacking on the z-coordinate to every list of two numbers. Sometimes your list of two numbers might not be a 2D point. So these rules must specifically target the bits which we know are coordinates. As a start we can transform Line and Text:

linerule[z_] := Line[points_, stuff___] :> Line[#~Append~z & /@ points, stuff];
textrule[z_] := {
   Text[t_, {x_, y_}, stuff___] :> Text[t, {x, y, z}, stuff], 
   Text[t_, stuff___] :> Text[t, {0, 0, z}, stuff] (* default coords *)
   };

Some primitives like Circle don't have a direct 3D analogue, so we have to do a bit more work:

circle3d[{x_, y_}, r_, z_] := BSplineCurve[
   {{r, 0, z}, {r, r, z}, {-r, r, z}, {-r, 0, z}, {-r, -r, z}, {r, -r,
      z}, {r, 0, z}},
   SplineKnots -> {0, 0, 0, 1/4, 1/2, 1/2, 3/4, 1, 1, 1},
   SplineWeights -> {1, 1/2, 1/2, 1, 1/2, 1/2, 1},
   SplineDegree -> 2];
circlerule[z_] := {
  Circle[{x_, y_}, r_?NumberQ, stuff___] :> circle3d[{x, y}, r, z],
  Circle[{x_, y_}, stuff___] :> circle3d[{x, y}, 1, z], (* default radius *)
  Circle[stuff___] :> circle3d[{0, 0}, 1, z] (* default coords and radius *)
  }

This spline construction is just from the help on BSplineCurve. It only works for a full circle, not arcs. For a full treatment of circles in space see (10957).

Further rules for Point, GraphicsComplex, Polygon, etc., are left as an exercise to the reader.

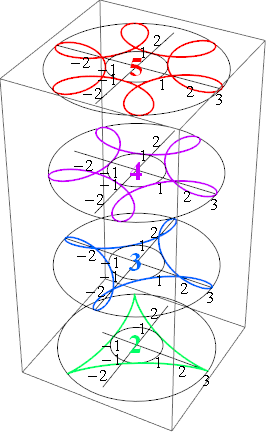
Now we can put it together to make our 3D graphic. FullGraphics is used to get Mathematica to provide the 2D primitives.

allrules[z_] := Flatten@Through[{linerule, textrule, circlerule}[z]];

Graphics3D[Table[First@FullGraphics@g@z /. allrules[z], {z, 2, 5}], BoxRatios -> {1,1,2}]
stack2

(This Q&A brought to you by the moderators' tireless efforts in cleaning up old and dead questions).

$\endgroup$
7
$\begingroup$

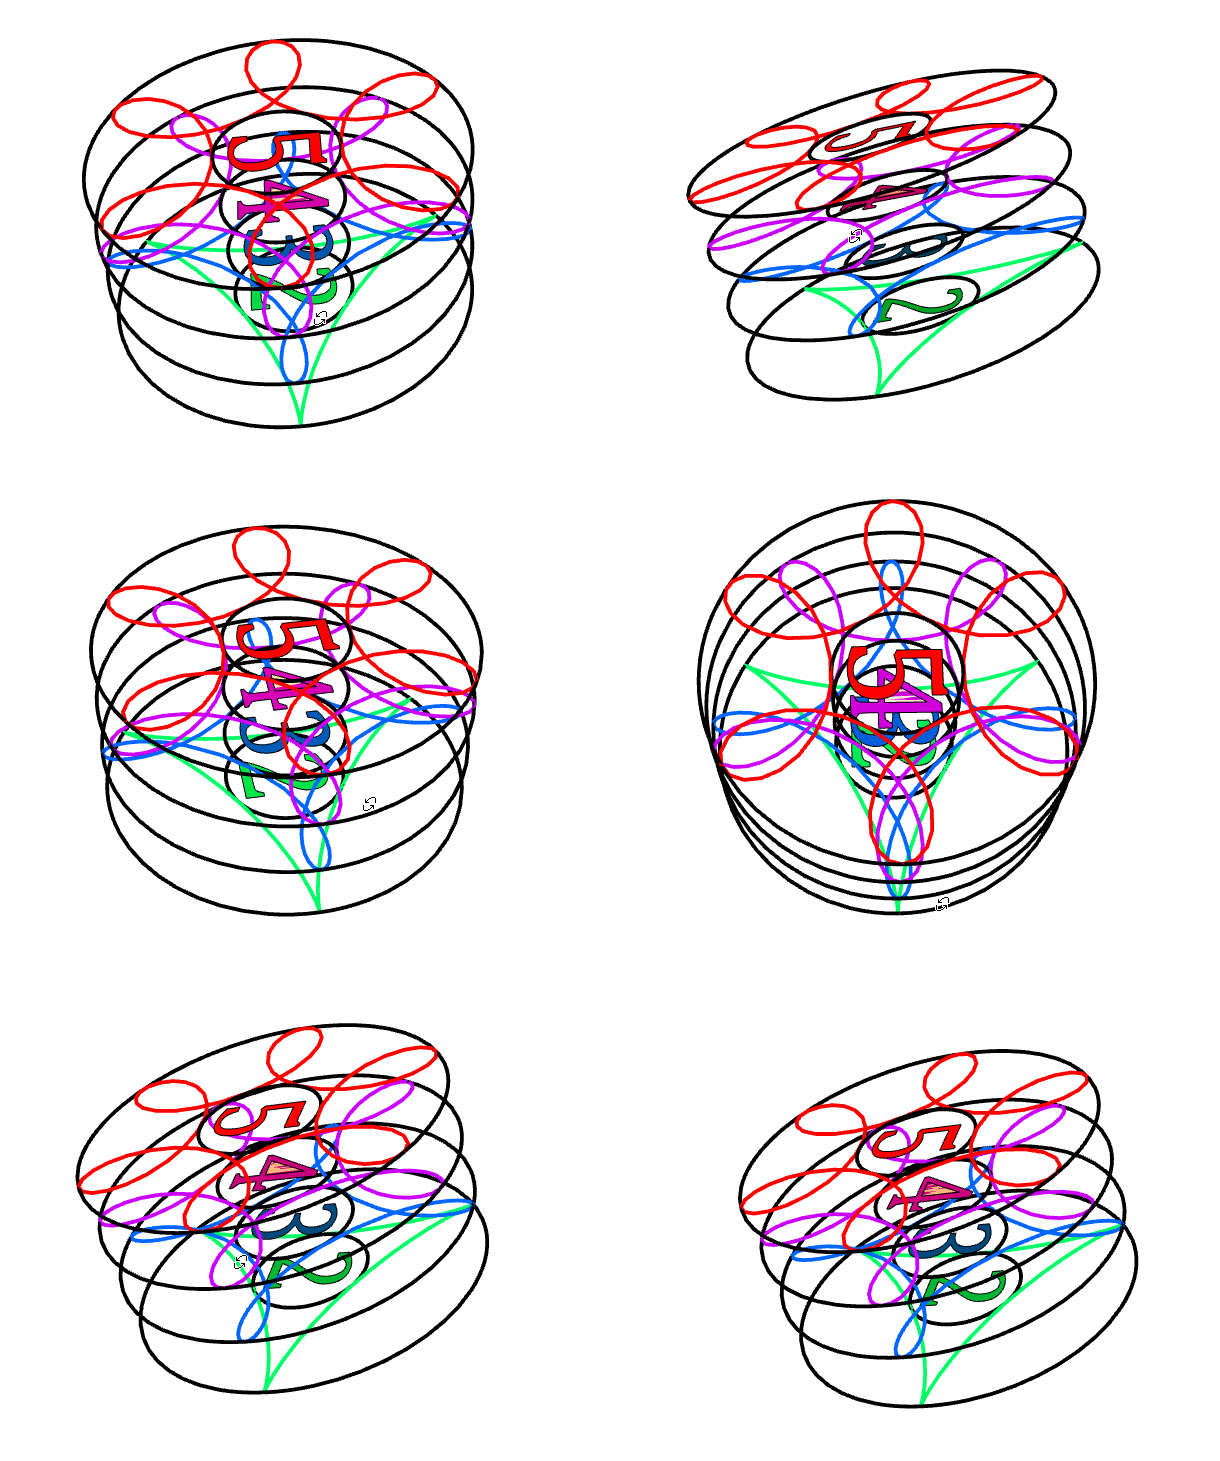
You could also do:

g[z_] := ParametricPlot3D[{{2 Cos[t] + Cos[z t], 2 Sin[t] - Sin[z t], 
     z}, {3 Cos[t], 3 Sin[t], z}, {Cos[t], Sin[t], z}}, {t, 0, 2 Pi}, 
   PlotStyle -> {{Thick, Hue[z/5]}, Black, Black}];

then,

plt = Show[Table[g@z, {z, 2, 5}], PlotRange -> All]

enter image description here

You can rescale as desired wrt box ratios or z.

The following is a ham-fisted way to put text in... the "4" is not ideal but a quick way to deal with filled curve of "4". Others will have nicer and better approaches.

Some code to get process text

t[s_, z_] := 
 With[{g = 
    Show[BoundaryDiscretizeGraphics[
      Text[Style[s, FontFamily -> "Cambria", FontSize -> 3]], _Text]]},
  p = {##, z} & @@@ g[[1, 1]];
  res = Cases[g, (Polygon | Line)[x__] :> x, Infinity];
  If[Length@res == 1, {Hue[z/5], 
    Polygon@p[[res[[1, 1]]]]}, {{Hue[z/5], 
     Polygon[p[[res[[1]]]]]}, {FaceForm[White], 
     Polygon[p[[res[[2]]]]]}}]
  ]

Visualizing:

txt = Graphics3D[Table[t[ToString@j, j], {j, 2, 5}]];
Show[plt, txt, Boxed -> False, Axes -> False]

enter image description here

Post script: I borrowed the BoundaryDiscretizeGraphics from a recent MSE post and copied (& pasted) and adapted...though I admit not best use.

$\endgroup$

Not the answer you're looking for? Browse other questions tagged or ask your own question.