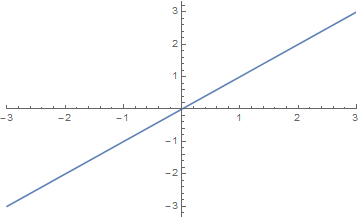
I am making a function that is to use Show to overlay a few plots of a function. I want the first Plot in Show to get its bounds from the First item in the PlotRange option. However, it keeps saying that it is not in the correct form. However, as far as I can tell it is in the correct form.
foo[f_, opts : OptionsPattern[Plot]] :=
 Flatten@{x, First@OptionValue[PlotRange]}
This shows that the expression Flatten@{x, First@OptionValue[PlotRange]} does provide the correct form for Plot.
foo[# &, PlotRange -> {{-3, 3}, Automatic}]
(*{x, -3, 3}*)
Now using this in Plot returns an error that it is not of the correct form.
foo[f_, opts : OptionsPattern[Plot]] :=
 Plot[f[x],Flatten@{x,First@OptionValue[PlotRange]},opts]

foo[# &, PlotRange -> {{-3, 3}, Automatic}]

Plot::pllim: Range specification Flatten[{x,First[OptionValue[Plot,{PlotRange->{{<<2>>},Automatic}},PlotRange]]}] is not of the form {x, xmin, xmax}. >>
Any ideas as to why this is the case. The above functions are just to demonstrate the issue. The actual ones are not as simple.

