5
$\begingroup$

I must advise you that I am an almost total novice in mathematica.. However here is my very simple question..

I know the command FindMaximum[{f},{x}] to find the maximum point and maximum value of a function, but I'm in a situation in which I can't use it properly

In particular: let's say I have a function $\phi(\omega,\theta,\varphi)$ defined on $0\le\omega<2\pi$, $0\le \theta,\varphi <\pi/4$ and with values in $\mathbb{R}^+$. Let's also consider another function, $l(\theta,\varphi)$, defined on $0\le \theta,\varphi <\pi/4$ and with values in $\mathbb{R}^+$.

My question is: what is the command to find the intervals of $\theta$ and $\varphi$ for which the maximum value on $\omega$ of $\phi(x,y,,\theta,\varphi)$ is smaller than $l(\theta,\varphi)$?

Thank you very much

$\endgroup$
1
  • $\begingroup$ It might make your problem easier to use the trigonometric parametrization of the circle; $\phi$ will now explicitly depend on just three variables. $\endgroup$ Commented Jun 23, 2015 at 23:50

1 Answer 1

6
$\begingroup$

Suppose

λ[ω_, θ_, ϕ_] := Sin[ω - θ] Cos[ϕ]
l[θ_, ϕ_] := 10 Sin[θ] Sin[ϕ]

then

enter image description here

Plot3D[{(ω /. Last@FindMaximum[λ[ω, θ, ϕ], {ω, π}]), l[θ, ϕ]}, 
    {θ, 0, π/4}, {ϕ, 0, π/4}]

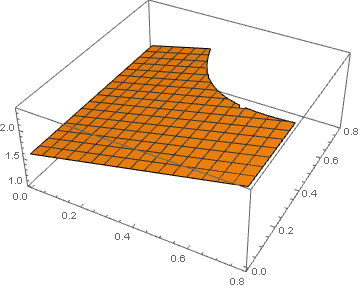
The desired answer is the orange surface when it is above the blue surface, which is obtained from

 Plot3D[If[(ω /. Last@FindMaximum[λ[ω, θ, ϕ], {ω, π}]) > l[θ, ϕ], 
      (ω /. Last@FindMaximum[λ[ω, θ, ϕ], {ω, π}])], {θ, 0, π/4}, {ϕ, 0, π/4}]

enter image description here

Edited Note: FindMaximum finds local maxima. Use Maximize instead to find global maxima but be aware that it can be much slower, two orders of magnitude for this simple case.

Addendum

In answer to a further question posed in a comment below, a function describing the boundary curve can be obtained by plotting the curve, extracting its internal representation, a List of points, and converting the list to an InterpolatingFunction.

cp = ContourPlot[(ω /. Last@FindMaximum[λ[ω, θ, ϕ], {ω, π}]) == l[θ, ϕ], 
       {θ, 0, π/4}, {ϕ, 0, π/4}] // Quiet;
f = Interpolation[First@Cases[cp, GraphicsComplex[z_, __] -> z, Infinity]]

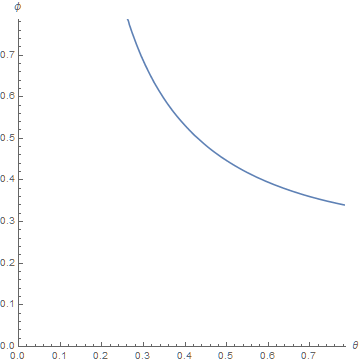
Although not a closed-form solution, f can be used like other functions in later calculations. As a simple example, it can be used to recover a Plot of the curve.

Plot[f[θ], {θ, f["Domain"][[1, 1]], f["Domain"][[1, 2]]}, AspectRatio -> 1, 
    PlotRange -> {{0, π/4}, {0, π/4}}, AxesLabel -> {θ, ϕ}]

enter image description here

Note that f["Domain"] simply provides the range in θ over which f is valid.

$\endgroup$
7
  • $\begingroup$ thank you! but can I also find equations for my orange surface? (this is what I really need) $\endgroup$
    – user61720
    Commented Jun 24, 2015 at 1:40
  • $\begingroup$ In general, the range of θ, ϕ will not exist in closed form and can only be shown as a plot of some sort. $\endgroup$
    – bbgodfrey
    Commented Jun 24, 2015 at 1:45
  • $\begingroup$ yes, but what you call "plot of some sort" is a surface (or a curve, or points) which must have an equation (at least locally). well I'm asking if I can have this equation $\endgroup$
    – user61720
    Commented Jun 24, 2015 at 1:48
  • $\begingroup$ You could try doing a numerical fit to the boundary, which in general could be quite complicated. $\endgroup$
    – bbgodfrey
    Commented Jun 24, 2015 at 1:52
  • $\begingroup$ can you explain me how do I do that in your example? $\endgroup$
    – user61720
    Commented Jun 24, 2015 at 1:53

Your Answer

By clicking “Post Your Answer”, you agree to our terms of service and acknowledge you have read our privacy policy.

Not the answer you're looking for? Browse other questions tagged or ask your own question.