2
$\begingroup$

So I'm working with this data set where there is just one input(a date and time) per line in a .csv file. I've let Mathematica understand the input using "DateStringFormat". The time looks like Year-Month-Day-Hour:Minute:Second

How do I go about plotting a cumulative histogram of events occurring (up until 100% at the end) where I have time on the x-axis and percent of events occurred on the y-axis?

$\endgroup$
7
  • $\begingroup$ Does each date represent a single event? Is that the only data in the file? Is the data sorted? $\endgroup$
    – N.J.Evans
    Commented Jun 9, 2015 at 21:22
  • $\begingroup$ An example of the data and some evidence of what you have tried so far would be helpful $\endgroup$ Commented Jun 9, 2015 at 21:27
  • 1
    $\begingroup$ I suspect you'll want to look up DateListPlot and MapIndexed $\endgroup$
    – george2079
    Commented Jun 9, 2015 at 21:35
  • $\begingroup$ Hey everyone, sample data looks like "2013-01-01-03:10:02.430"} $\endgroup$ Commented Jun 9, 2015 at 21:52
  • $\begingroup$ shouldn't Histogram[data, "Log", {"Log", "CumulativeCount"}] work? where data is the total imported set $\endgroup$ Commented Jun 9, 2015 at 21:52

1 Answer 1

3
$\begingroup$

synthetic data:

 strings = 
   DateString /@ 
   Sort@RandomVariate[ NormalDistribution[AbsoluteTime[Date[]], 10^7],200];

Note this date string format is not exactly the same as yours but I think all this will still work.

 DateListPlot[MapIndexed[ {#, First@#2} &, strings ], 
    Ticks -> {DateRange[{2013, 12}, {2016, 2}, {{3, "Month"}}], 
       Automatic}, Axes -> True, Frame -> False, 
        DateTicksFormat -> {"MonthShort", "/", "Year"}]
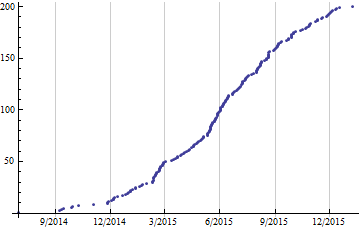
enter image description here

make that MapIndexed[ {#, 100 First@#2/Length@strings} &, strings ] for "%" ..

If you want the data binned: ( DateListPlot also has some binning options, but it will not look like a histogram bar chart)

 Histogram[ (AbsoluteTime /@ strings - AbsoluteTime@strings[[1]] ) // 
   #/(60 60 24) &, Automatic , "CumulativeCount" , 
   AxesLabel -> {"days", "event count"}]

enter image description here

(sorry that plot label should be "days" .. )

$\endgroup$

Your Answer

By clicking “Post Your Answer”, you agree to our terms of service and acknowledge you have read our privacy policy.

Not the answer you're looking for? Browse other questions tagged or ask your own question.