I am using SmoothDensityHistogram on a data set of the form
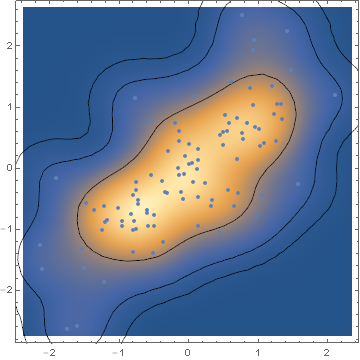
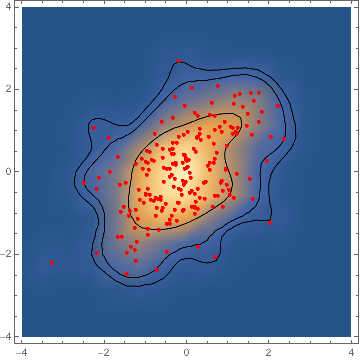
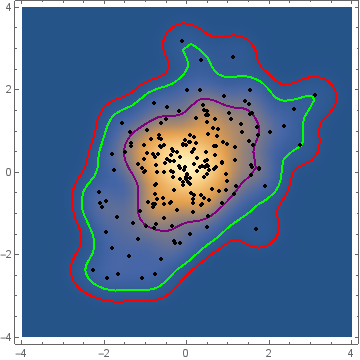
{{x1, y1}, {x2, y2}, …, {x_n, y_n}}, and I would like to also show the contour lines that enclose 68%, 95% and 99% of the points.
With the option MeshFunctions -> {#3 &}, Mesh -> 3 I can have 3 contour lines, but how can I set the probability at which the contours lines are?

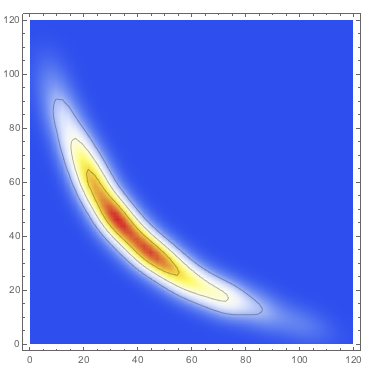
As this image show, the distribution of points does not necessarily follow a binormal distribution, so I need something more general than confidence ellipses calculated with Mean and Covariance.
It seems like a common enough plot that an easy solution should exist but I can't figure out how.


MeanandCovariance. $\endgroup$