1
$\begingroup$

I want to plot say Sin(x) with colorfilling. but I want the colour to be a gradient between white and red. When Abs[sin(x)] is maximum I want white, when its minimum I want the filling to be red. In other words have a gradient of a single color.

I have tried

Plot[Sin[x],{x,0,6.0},PlotStyle-> Red,PlotRange->All,
     ColorFunction->Function[{x,y},Hue[1, 1, 1, Abs[y]]],Filling->Axis]

thanks

$\endgroup$
4
  • $\begingroup$ Please check the last example in the Scope-Filling Style sub-subsection of the documentation for Filling. reference.wolfram.com/language/ref/Filling.html . All you need, is to provide a different function to get red-white instead of the rainbow. $\endgroup$
    – LLlAMnYP
    Commented May 27, 2015 at 14:10
  • $\begingroup$ I tried that. But can't seem to make it work for two colors $\endgroup$ Commented May 27, 2015 at 14:19
  • $\begingroup$ Please show the code that you tried. $\endgroup$
    – LLlAMnYP
    Commented May 27, 2015 at 14:36
  • $\begingroup$ Plot[Sin[x],{x,0,6.0},PlotStyle-> Red,PlotRange->All, ColorFunction->Function[{x,y},Hue[1, 1, 1, Abs[y]]],Filling->Axis] $\endgroup$ Commented May 27, 2015 at 14:39

1 Answer 1

2
$\begingroup$

EDIT this isn't what OP had in mind, but I'll let the answer linger for the related and linked questions.

EDIT 2 to provide a very brief answer for the intended question:

ParametricPlot[{x, y Sin[x]}, {x, 0, 6}, {y, 0, 1}, PlotStyle -> Red, 
 ColorFunctionScaling -> False, 
 ColorFunction -> (Blend[{Red, White}, Abs@#2] &)]
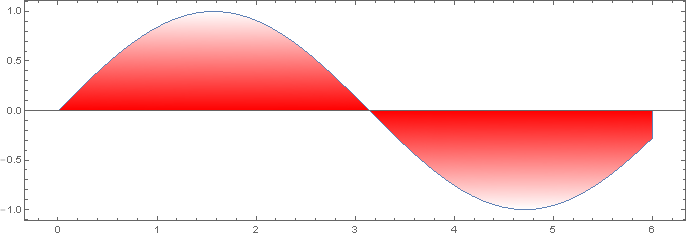
Parametric Plot

Old answer

That's a common mistake to make. The reason for this is ColorFunctionScaling. It remaps the range of values to run from 0 to 1 across the plot range. So basically, where Sin[x] is closest to -1, the filling is fully transparent, and where Sin[x] is closest to 1 it is fully opaque. The Abs here does not change anything.

First of all, you'll need to set ColorFunctionScaling -> False:

Plot[Sin[x], {x, 0, 6.0}, PlotStyle -> Red, PlotRange -> All, 
 ColorFunctionScaling -> False, 
 ColorFunction -> Function[{x, y}, Hue[1, 1, 1, Abs[y]]], 
 Filling -> Axis]

Scaling off

But now it is white (or, rather, transparent) only very close to zero as opacity kicks in quite fast. If you must have transparency, you can, for example, replace the alpha argument with 1 - Abs[y]^3 or Abs[y]^3 (depending, where you want red and where white):

Different color function

But if you ask me, the simplest way is just ColorFunction -> (Blend[{Red, White}, Abs[#2]] &)

Plot[Sin[x], {x, 0, 6.0}, PlotStyle -> Red, PlotRange -> All, 
 ColorFunctionScaling -> False, 
 ColorFunction -> (Blend[{Red, White}, Abs[#2]] &), Filling -> Axis]

Blend

Note, that the filling here is white and not transparent. If transparency is necessary, you can try instead (Blend[{RGBColor[1, 0, 0, 1], RGBColor[1, 1, 1, 0]}, Abs[#2]] &)

$\endgroup$
2
  • $\begingroup$ thanks for your response. may be my question was not completely clear. Here the colour gradient is along x. I need something where colour gradient is along y, i.e. for the same x the colour varies along y. $\endgroup$ Commented May 27, 2015 at 15:01
  • $\begingroup$ I see. In this case this is a duplicate of mathematica.stackexchange.com/questions/2988/… $\endgroup$
    – LLlAMnYP
    Commented May 27, 2015 at 15:04

Your Answer

By clicking “Post Your Answer”, you agree to our terms of service and acknowledge you have read our privacy policy.

Not the answer you're looking for? Browse other questions tagged or ask your own question.