3
$\begingroup$

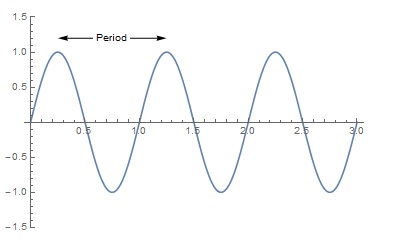
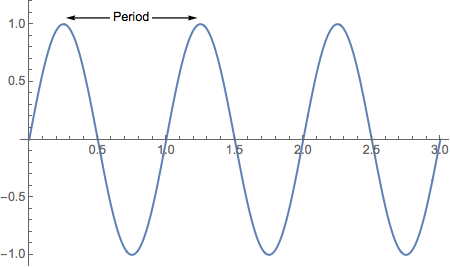
Suppose I wish to generate the following figure in Mathematica:
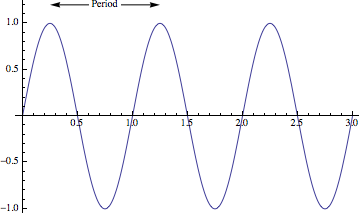
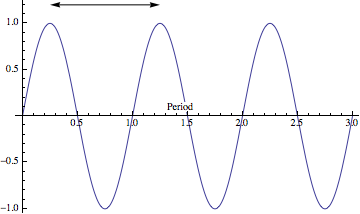
Plot of sinusoidal function with labeled arrow indicating one period of oscillation

My thought was to build it in parts. First, I make the plot:

p = Plot[Sin[2 Pi x], {x, 0, 3}]

Plot of Sin[2 Pi x]

Then I make the annotation:

g = Graphics[{
    Arrowheads[{-0.03, 0.03}], Arrow[{{1/4, 1.2}, {5/4, 1.2}}], 
    Style[Text[" Period ", Center], Background -> White]
}]

Double-headed arrow labeled "Period"

But when I combine them, Mathematica interprets the Center specification I gave to Text to mean the center of the entire figure, rather than the center of the Arrow. So I get the unfortunate output

Show[p, g, PlotRange -> All]

My incorrect attempt to combine the plot with the arrow

How do I tell Mathematica I want the Text's position to be centered relative to the Arrow, not relative to the entire figure?

(I have a lot of things like this to do, so I prefer not to have to specify coordinates for the Text explicitly.)

$\endgroup$

5 Answers 5

3
$\begingroup$

Use inset. Then only the center needs specification. Even Arrow can be defined in its own coordinate system.

Plot[Sin[2 Pi x], {x, 0, 3}, 
 Epilog -> 
  Inset[Graphics[{Arrowheads[{-0.1, 0.1}], Arrow[{{0, 1}, {1, 1}}], 
     Style[Text[" Period ", Center], Background -> White]}], {.75, 
    1.2}], PlotRange -> 1.3]

enter image description here

$\endgroup$
2
  • $\begingroup$ Inset looks like probably a good approach. But I do still want to use my knowledge of the endpoints, rather than computing what the center ought to be. Also you have included no provision to be sure the scale of the annotation is correct relative to the scale of the graph. $\endgroup$ Commented May 25, 2015 at 23:02
  • 1
    $\begingroup$ I can address both of these concerns by using more arguments in Inset, namely: Epilog -> Inset[Graphics[…], {1/4, 1.2}, {0, 1}, 5/4 - 1/4] $\endgroup$ Commented May 25, 2015 at 23:02
2
$\begingroup$

You can also create a custom Arrowheads directive using the label as an arrow head:

arrowheads[lbl_] := Arrowheads[{{-0.04, 0}, {0.04, 1}, 
    {.1, .5, Graphics @ Text @ Framed[lbl, FrameStyle -> None, Background -> White]}}];

Plot[Sin[2 Pi x], {x, 0, 3}, 
 Epilog -> {arrowheads["Period"], Arrow[{{0.25, 1.1}, {1.25, 1.1}}]}, 
 PlotRange -> 1.3]

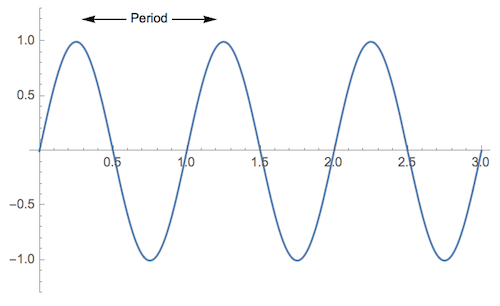
enter image description here

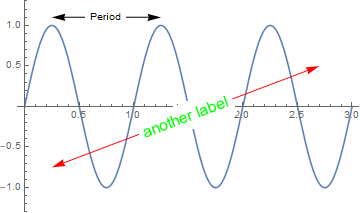
Plot[Sin[2 Pi x], {x, 0, 3}, 
 Epilog -> {arrowheads["Period"], Arrow[{{0.25, 1.1}, {1.25, 1.1}}], 
   Red, arrowheads[Style["another label", Green, 16], 
   Arrow[{{.25, -.75}, {2.7, .5}}]}, 
 PlotRange -> 1.3]

enter image description here

$\endgroup$
1
$\begingroup$
p = Plot[Sin[2 Pi x], {x, 0, 3}, PlotRange -> 1.5];
g = Graphics[{Arrowheads[{-0.03, 0.03}], 
    Arrow[{{1/4, 1.2}, {5/4, 1.2}}], 
    Style[Text[" Period ", Mean@{{1/4, 1.2}, {5/4, 1.2}}], 
     Background -> White]}];

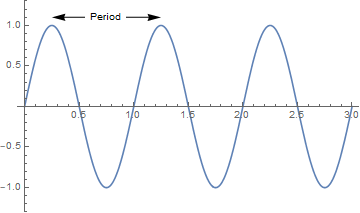
enter image description here

$\endgroup$
2
  • $\begingroup$ True, that works in the simple case, but I'd still prefer a more general solution for centering items relative to other items without having to specify coordinates explicitly. (For instance, on LogPlots and LogLogPlots, the midpoint of two coordinates is more complicated than just their arithmetic mean.) $\endgroup$ Commented May 25, 2015 at 22:38
  • $\begingroup$ @thecommexokid Center places the Text at the center of the image not the center of the plot object. check this Graphics[{Arrowheads[{-0.03, 0.03}], Arrow[{{1/4, 1.2}, {5/4, 1.2}}], Style[Text[" Period ", Center], Background -> White]}, Axes -> True, AxesOrigin -> {-2, 0}] you need to manipulate used coordinate to specify the position of the text $\endgroup$ Commented May 25, 2015 at 23:55
1
$\begingroup$

It can be done with Epilog and Inset. One must take care about the coordinates of the arrow, the text, and the inset box.

Plot[Sin[2 Pi x], {x, 0, 3},
  PlotRange -> All,
  PlotRangePadding -> {Automatic, {Automatic, .2}},
  Epilog -> 
    Inset[Graphics[{
      Arrowheads[{-0.07, 0.07}],
      Arrow[{{0, 0}, {1, 0}}], 
      Text[Style[" Period ", Background -> White], {.5, 0}]}],
    {.75, 1.05}]]

plot

Note that the end points of the arrow are placed at x = 0 and x = 1 and the text is centered at x = .5, the mid-point of arrow. These coordinates are local to the inset box. Then the inset box is centered at plot coordinates x = .75 and y = 1.05 to position the annotation properly in plot.

$\endgroup$
1
  • $\begingroup$ This answer still requires me to compute where I want the center of the inset box to go, which is exactly what I wanted to avoid in the original question. Using the various answers I've received here, I've posted my own Answer that uses the 4-argument form of Inset to avoid this. $\endgroup$ Commented May 26, 2015 at 16:53
0
$\begingroup$

First we create the plot:

p = Plot[Sin[2 Pi x], {x, 0, 3}];

Next we create the arrow, in its own system of coordinates. We will find it convenient to choose coordinates such that the arrow begins at the origin and is of unit size:

g = Graphics[{
    Arrowheads[{-0.1, 0.1}], Arrow[{{0, 0}, {1, 0}}],
    Style[Text[" Period ", Center], Background -> White]
}];

Finally we'll use the four-argument form of the Inset function (Inset[obj, pos, opos, size]) to insert the arrow into the plot. To use, we must specify the object obj we wish to inset, two points — pos in the main plot's system of coordinates and opos in the arrow's system of coordinates — which should coincide in the final graphic, and a size parameter to set the relative scale of the two objects.

We'll choose pos to be {1/4, 1.2}, the position where we want the arrow to begin, which means we should choose opos to be {0, 0}. And since we made our arrow unit-sized, the size parameter should just be the total desired width of the arrow in the plot's coordinate system, here 5/4 - 1/4. Putting it all together,

Show[p, PlotRangePadding -> {Automatic, {Automatic, 0.3}}, 
    Epilog -> Inset[g, {1/4, 1.2}, {0, 0}, 5/4 - 1/4]]
$\endgroup$

Your Answer

By clicking “Post Your Answer”, you agree to our terms of service and acknowledge you have read our privacy policy.

Not the answer you're looking for? Browse other questions tagged or ask your own question.