1
$\begingroup$

I solved Navier Stokes equation in C for lid driven cavity flow and extracted converged values of u velocity and v velocities in .dat file.

Is there a way to generate streamlines from these discrete values of u and v in Mathematica?

u.dat & v.dat

I have attached link for u.dat and v.dat files, but even if someone can guide me with his own data set, I will be thankful.

$\endgroup$
2
  • 2
    $\begingroup$ And what is the u and v? Have you looked in the ListStreamPlot documentation? $\endgroup$
    – m0nhawk
    Commented Apr 12, 2015 at 6:45
  • $\begingroup$ @m0nhawk : Hi, I looked in the documentation of ListStreamPlot but was not able to figure out my problem. u is the x direction velocity and v is the y component of velocity. I solved NS equations using FDM methods on a grid size of 401X401, so basically u and v represents velocity values at these grid points. u and v are 401X401 matrix $\endgroup$
    – user11948
    Commented Apr 12, 2015 at 17:05

1 Answer 1

2
$\begingroup$

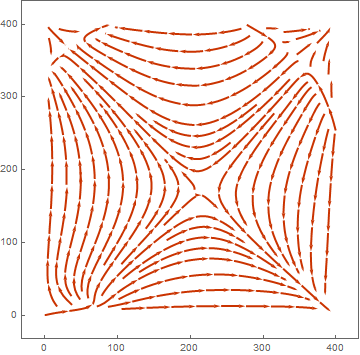
enter image description here

The main thing with the ListStreamPlot is that it needs a data in a form of list of {{x, y}, {vx, vy}} pairs.

vx = Import["Re1000_c100_u.dat", "CSV"];
vy = Import["Re1000_c100_v.dat", "CSV"];

x = Table[j, {i, 0, Length[vx] - 1}, {j, 0, Length[vy] - 1}];
y = Table[i, {i, 0, Length[vx] - 1}, {j, 0, Length[vy] - 1}];

ListStreamPlot@MapThread[{{#1, #2}, {#3, #4}} &, {x, y, vx, vy}, 2]

I'm not sure if the MapThread is the most efficient way to create a necessary list.

$\endgroup$
1
  • 2
    $\begingroup$ Transpose[{{x, y}, {vx, vy}}, {3, 4, 1, 2}] is another way to arrange the data for ListStreamPlot. (+1) $\endgroup$
    – Michael E2
    Commented Apr 12, 2015 at 17:48

Your Answer

By clicking “Post Your Answer”, you agree to our terms of service and acknowledge you have read our privacy policy.

Not the answer you're looking for? Browse other questions tagged or ask your own question.