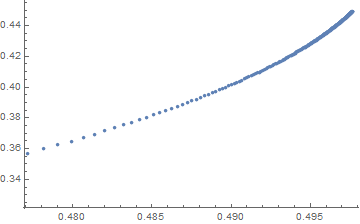
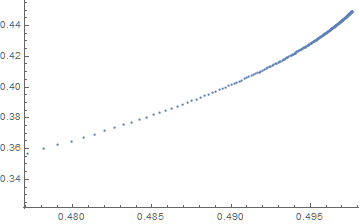
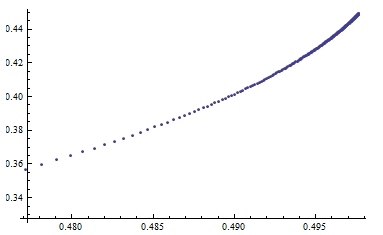
Here is my code
tt[t_] := (t/(1 - t));
b[k_, n_, pf_] := \!\(\*UnderoverscriptBox[\(\[Sum]\), \(i = 0\), \(k\)]\(Binomial[n, i] \*SuperscriptBox[\(pf\), \(i\)] \*SuperscriptBox[\((1 - pf)\), \((n - i)\)]\)\)
l[t_, n_] := 1/(1 + tt[t]^n) - b[Floor[n/2], n, t];
Table[FindMaximum[l[t, i], {t, 0.4}], {i, 3, 501, 2}]
The result is as follows:
{{0.148148, {t -> 0.333333}}, {0.204148, {t -> 0.384677}},.....
I want to Listplot the data: {(0.333333,0.148148),(0.384677,0.204148),.....}
but I dont know how to manipulate the output of Table so that I can plot it. I am not able to do it manually therefore wanted to ask it.


